Troubleshooting Cody
Learn about common reasons for errors that you might run into when using Cody and how to troubleshoot them.
If you encounter errors or bugs while using Cody, try applying these troubleshooting methods to understand and configure the issue better. If the problem persists, you can report by asking in the Discord server.
VS Code extension
Cody is not responding in chat
If you're experiencing issues with Cody not responding in chat, follow these steps:
- Ensure you have the latest version of the Cody VS Code extension. Use the VS Code command
Extensions: Check for Extension Updatesto verify - Check the VS Code error console for relevant error messages. To open it, run the VS Code command
Developer: Toggle Developer Toolsand then look in theConsolefor relevant messages
Cody responses/completions are slow
If you're experiencing issues with Cody's responses or completions being too slow:
- Ensure you have the latest version of the Cody VS Code extension. Use the VS Code command
Extensions: Check for Extension Updatesto verify - Enable verbose logging, restart the extension and reproduce the issue seen again (see below
Access Cody logsfor how to do this) - Send information to the our Support Team at [email protected]
Some additional information that will be valuable:
- Where are you located? Any proxies or firewalls in use?
- Does this happen with multiple providers/models? Which models have you used?
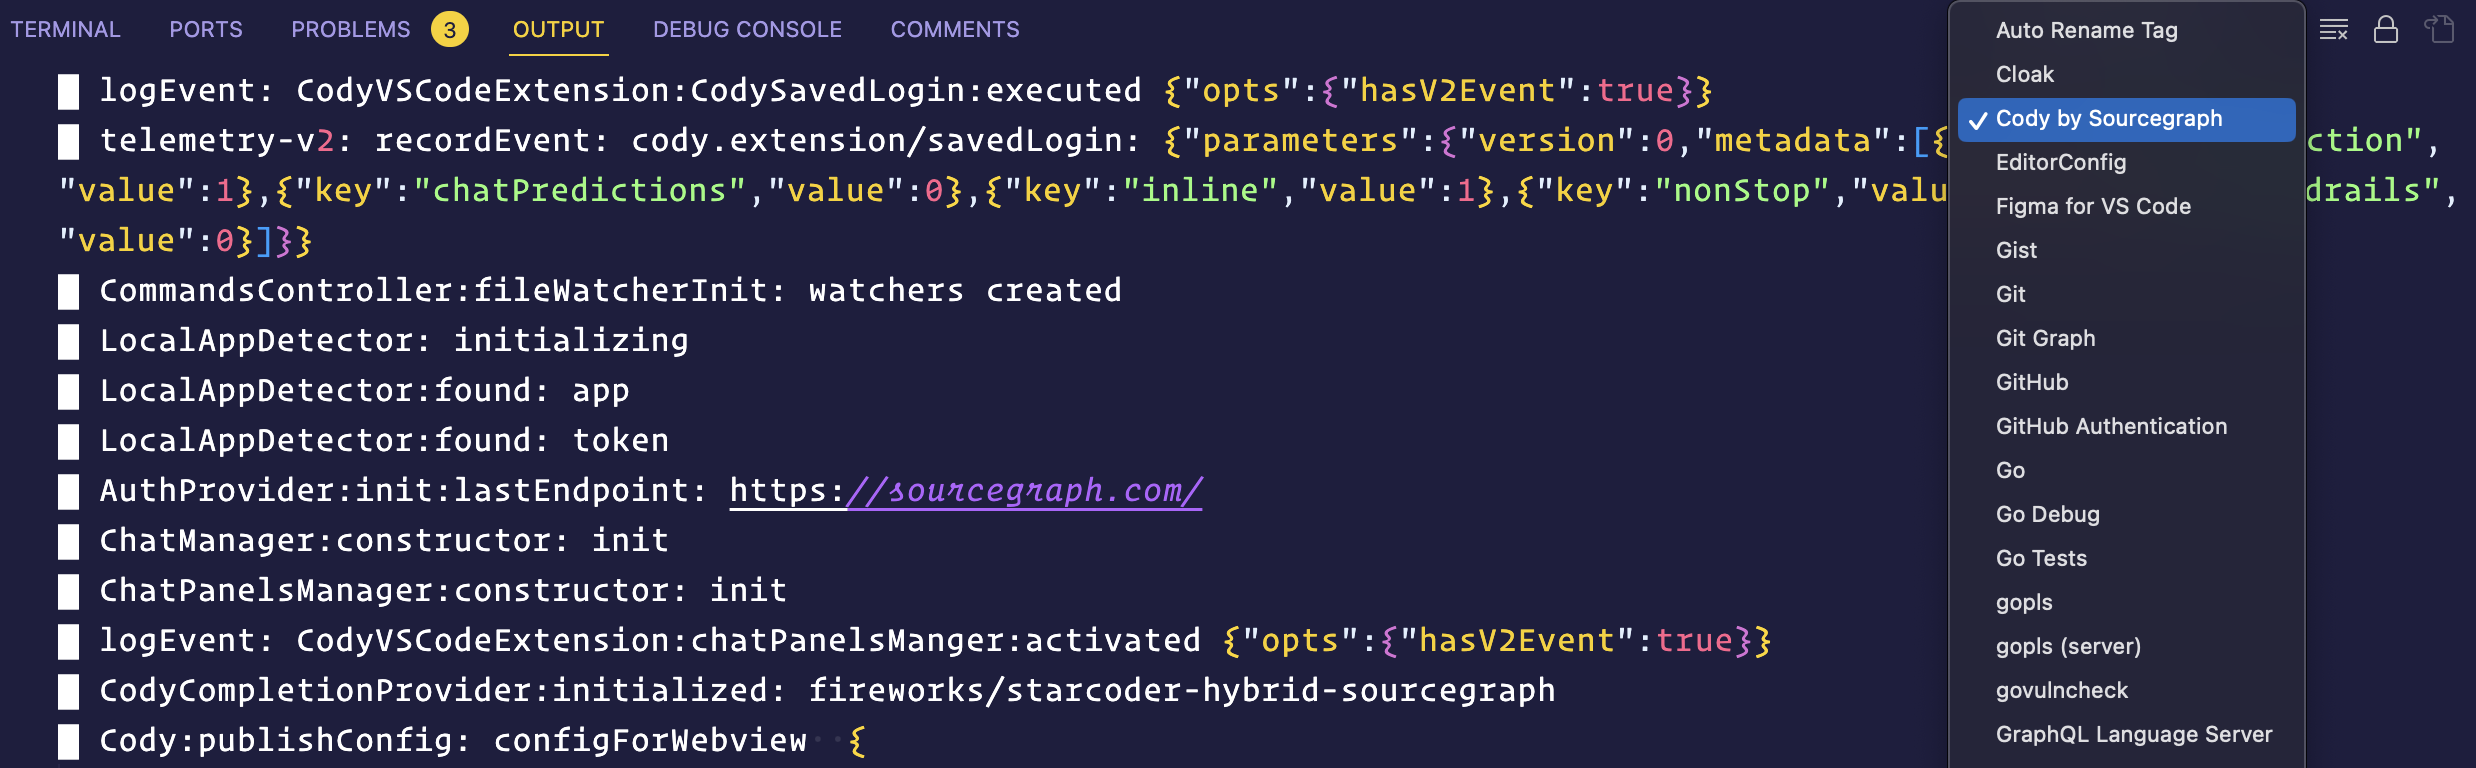
Access Cody logs
VS Code logs can be accessed via the Outputs view. You will need to set Cody to verbose mode to ensure important information to debug is on the logs. To do so:
- Go to the Cody Extension Settings and enable:
Cody › Debug: Verbose - Restart or reload your VS Code editor
- You can now see the logs in the Outputs view
- Open the view via the menu bar:
View > Output - Select Cody by Sourcegraph from the dropdown list
- You can export the logs by using the command palette (Cmd+Shift+P on Mac, Ctrl+Shift+P on Windows/Linux) and searching for the "Cody Debug: Export Logs" command
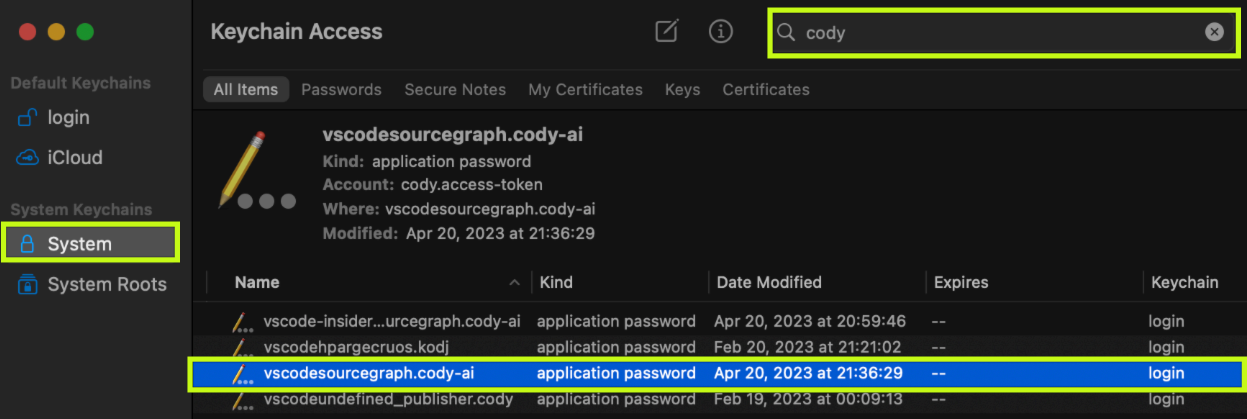
Errors trying to install Cody on macOS
If you encounter the following errors:
BASHCommand 'Cody: Set Access Token' resulted in an error

Command 'cody.set-access-token' not found
Follow these steps to resolve the issue:
- Close your VS Code editor
- Open your Keychain Access app
- Search for
cody - Delete the
vscodesourcegraph.cody-aientry in the system keychain on the left - Reopen the VS Code editor. This should resolve the error
Signin fails on each VS Code restart
If you find yourself being automatically signed out of Cody every time you restart VS Code, and suspect it's due to keychain authentication issues, you can address this by following the steps provided in the official VS Code documentation on troubleshooting keychain issues. These guidelines should help you troubleshoot and resolve any keychain-related authentication issues, ensuring a seamless experience with Cody on VS Code.
No context files were included by Cody
If Cody's answers don't seem accurate, it may be because Cody is unable to find the right relevant files to use as context. You can see which files Cody used in the Context row right below your message.
To troubleshoot further:
- Enable the
cody.debug.verbosesetting in your VS Code user settings. - Open the Cody by Sourcegraph output channel in VS Code.
- Look for log messages such as the following:
BASH█ SimpleChatPanelProvider: getEnhancedContext > search
█ symf: using downloaded symf "/Users/beyang/Library/Application Support/Code/User/globalStorage/sourcegraph.cody-ai/symf/symf-v0.0.6-aarch64-macos"
█ SimpleChatPanelProvider: getEnhancedContext > search (end)
█ DefaultPrompter.makePrompt: Ignored 8 additional context items due to limit reached
Rate limits
On Enterprise plans, usage limits are increased, and controlled by Fair Usage. This means that some users occasionally experience a limitation placed on their account. This limitation resets within 24 hours. If this issue persists, contact us through our Discord, or email [email protected].
Error logging in VS Code on Linux and Windows
If you encounter difficulties logging in to Cody on Linux using your Sourcegraph instance URL, along with a valid access token, and notice that the sign-in process in VS Code hangs, it might be related to underlying networking rules concerning SSL certificates.
To address this, follow these steps:
- Close your VS Code editor
- In your terminal, type and run the following command:
echo "export NODE_TLS_REJECT_UNAUTHORIZED=0">> ~/.bashrc - Restart VS Code and try the sign in process again
On Windows,
- Close Visual Studio Code
- In your Command Prompt or PowerShell window, run the following command:
setx NODE_TLS_REJECT_UNAUTHORIZED 0 - Restart Visual Studio Code and try the sign in process again
Cloudflare Request Failed
If you encounter this error:
BASHRequest Failed: Request to https://sourcegraph.com/.api/completions/stream?api-version=1&client-name=vscode&client-version=1.34.3 failed with 403 Forbidden
It indicates that our web application firewall provider, Cloudflare, has flagged the source IP as suspicious.
Consider disabling anonymizers, VPNs, or open proxies. If using a VPN is essential, you can try 1.1.1.1, which is recognized to be compatible with our services.
Error with Cody contextFilters during chat or editing code
The contextFilters setting in Cody is used to control which files are included or excluded when Cody searches for relevant context while answering questions or providing code assistance. Sometimes, you can see the following error:
BASHEdit failed to run: file is ignored (due to cody.contextFilters Enterprise configuration setting)
This error occurs when you're trying to work with a file that's been excluded by Cody's enterprise-level contextFilters configuration. At times, this can happen to files that also haven't been excluded. First, check with your organization's admin to understand which files are excluded.
If the error occurs with a file that's not been excluded, the workaround is to uninstall the Cody plugin, restart your IDE and then reinstall the latest version of the extension.
This should clear the error.
Error exceeding localStorage quota
When using Cody chat, you may come across this error:
BASHFailed to execute 'setItem' on 'Storage': Setting the value of 'user-history:$user_id' exceeded the quota.
This error indicates that the chat history size surpasses the capacity of your browser's local storage. Cody stores comprehensive context data with each chat message, contributing to this limitation.
To fix this, navigate to https://sourcegraph.your-domain.com/cody/chat and click Clear Chat History if your instance is on v5.2.3+. For older versions, clear your browsing data or browser history.
Record performance traces for Cody
You can get performance traces from the Cody VS Code extension in production with full support for source maps. To do so:
- Start VS Code with a special runtime flag. In macOS, you can do so via the terminal like this:
BASH/Applications/Visual\ Studio\ Code.app/Contents/MacOS/Electron --inspect-extensions=9333
Note that you may need to quit VSCode first, then run that command to re-launch it. It will open all of your windows and tabs again.
- After VS Code is started, head over to Chrome and go to
chrome://inspect, which takes you to the following:
- Configure the inspect server you started on port
9333from here. To do so, click on Open dedicated DevTools for Node, then go to the Connection tab, and make sure to addlocalhost:9333to the list
- Now head back to the
chrome://inspecttab, and you should see a new remote target that you can inspect
- Clicking this will open a (somewhat reduced) DevTools view. Great! We've almost got it. From here you can go to the Performance tab to record a trace. And finally, swap tabs to the VS Code window and interact with the extension. Come back later to stop the recording and export it.
Record a CPU profile for Cody in VSCode
If you are experiencing performance issues with Cody in VSCode, recording a CPU profile can help diagnose the problem. Here’s how you can capture a CPU profile:
-
Open Developer Tools:
- In VSCode, go to the Command Palette (
Ctrl+Shift+Pon Windows/Linux,Cmd+Shift+Pon macOS). - Type
Developer: show running extensionsand select it to open running extensions.
- In VSCode, go to the Command Palette (
-
Record the CPU Profile:
- There you should see Cody in the list. Right click on it and start a host profile.
- This will show you the running profile in the bottom right of the window.
- Reproduce the issue you are experiencing with Cody.
- Once you have reproduced the issue, click the message in the bottom right you stop the trace.
-
Save the CPU Profile:
- After stopping the trace, you need to go back to the Developer: show running extensions view.
- Right click Cody and click
Save extension profile.
-
Share the CPU Profile:
- Attach the
.cpuprofilefile to your issue report on GitHub or share it with the support team for further analysis.
- Attach the
Following these steps will help the team understand and resolve the performance issues more effectively.
JetBrains IntelliJ extension
Access Cody logs
JetBrains logs can be accessed via the Output panel. To access logs, you must first enable Cody logs from the Settings menu. To do so:
- Open the Settings panel (
⌘,for macOS) (Ctrl+Alt+Sfor Windows/Linux) - Go to
Sourcegraph & Cody - Click on
Cody - Check the box to Enable debug
- Optionally, select the box to enable Verbose debug
- Click Apply
- To access the logs, go to Help - Show Log in Finder
- Open the
idea.logfile
High CPU Usage with Cody Agent
If you notice the Cody agent reaching 100% CPU utilization, try the following:
- Disable the Cody plugin.
- Re-enable the plugin. This simple action of turning the plugin off and on again can often resolve the high CPU usage issue.
Android Studio extension
Cody cannot start. Stuck on spinning icon.
This issue occurs because JCEF isn't supported in Android Studio and causes Cody to not start. The suggested workaround is to:
- Go to
Help>Find Action: Registry. - Scroll to
ide.browser.jcef.sandbox.enable. - Disable that key and close.
- Then go to
Help>Find Action: Choose Boot runtime for the IDE. - Select the last option.
- Restart Android Studio.
Visual Studio extension
Access Cody logs
Visual Studio logs can be accessed via the Output panel. To access logs:
- Open
View -> Outputfrom the main menu - Select
Codyoutput pane

Autocomplete
Cody autocomplete for Visual Studio uses the underlying VS API to display completions in the editor. It's turned on by default in VS (Tools -> Options -> IntelliCode -> Show Inline Completions). Without this setting enabled, autocomplete will not work, so this is the first thing to check.
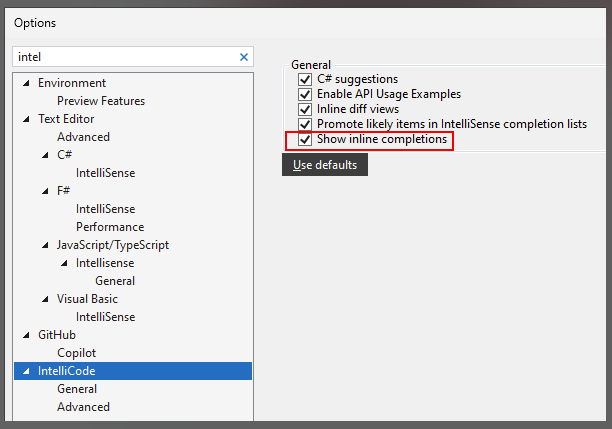
Also make sure that Tools -> Options -> Cody -> Automatically trigger completions is turned on (it is by default).

Autocomplete is supported from Visual Studio 17.6+ and includes support for the following languages:
- C/C++/C#
- Python
- JavaScript/TypeScript/TSX
- HTML
- CSS
- JSON
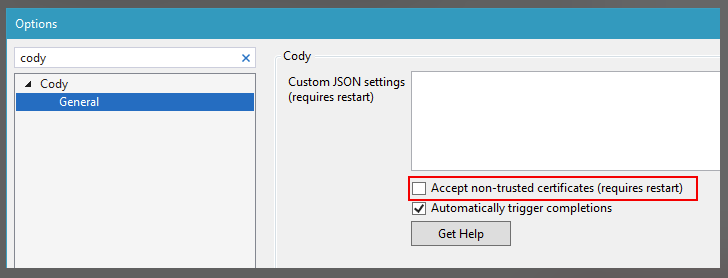
Non-trusted certificates
If autocomplete still doesn't work (or the Cody Chat), you could try turning on the option to accept non-trusted certificates (requires Visual Studio restart). This should help, especially in enterprise settings if you are behind a firewall.
Detailed debugging logs
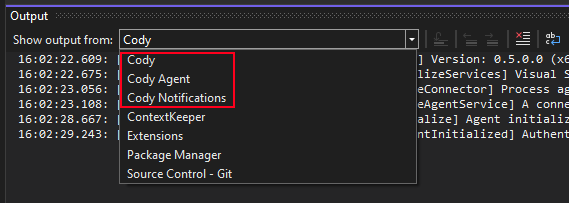
The detailed logging configuration can be turned on by adding the CODY_VS_DEV_CONFIG environment variable containing the full path to the configuration file placed somewhere in the filesystem.

Two additional output panes, Cody Agent and Cody Notifications, will be created with more detailed logs. More information on how to configure them is available here.
Regular Expressions
Asterisks being removed
If you send Cody a prompt with a query string like $filteredResults = preg_grep('*\.' . basename($inputPath) . '\.*', $fileList);, the asterisks may be removed because Cody interprets the content as a literal string rather than code.
When sharing code with Cody, wrap your code in triple backticks (```) to ensure it's recognized as a code block rather than plain text. For example:
REGEX```
$filteredResults = preg_grep('*\.' . basename($inputPath) . '\.*', $fileList);
```
Forked Repos As Context
If you would like to add a forked repository as Cody context, you may need to add "search.includeForks": true to the global settings for your instance.
OpenAI o1
Context Deadline Exceeded Error
Symptoms:
- "Request Failed: Request to... failed with 500 Internal Server Error: context deadline exceeded"
- Happens even with relatively small inputs (~220 lines)
Solutions:
- Keep input context smaller - aim for less than 200 lines of code initially
- Break down larger requests into smaller chunks
- Start a new chat session if errors persist
- Add "Keep your answer brief!" to prompts when possible
Prevention:
- Import only the most relevant files
- Use file range syntax (e.g., @file:1-100) to limit context
- Focus on specific sections rather than entire codebases
Truncated Outputs
Symptoms:
- Response cuts off mid-sentence
- Unable to get complete code examples
- "Continue" requests also result in truncation
Solutions:
- Break down complex requests into smaller steps
- Consider using Sonnet 4 for tasks requiring longer outputs
Limits:
- Input tokens: 45k
- Output tokens: 4k
Model Switching Issues
Symptoms:
- Model reverts to Sonnet 3.5 unexpectedly
- "On waitlist" message appears after previously having access
- Unable to select o1 models in command palette
Solutions:
- Restart IDE/VS Code
- Sign out and sign back in
- Contact support if issues persist
Response Format Errors
Symptoms:
- "Request Failed: Unexpected response format"
- Model stops responding
- Inconsistent output formatting
Solutions:
- Cancel and retry the request
- Start a new chat session
- Reduce context complexity
- Use one-shot prompts with clear requirements