Sourcegraph Analytics
Enterprise customers can use Sourcegraph Analytics to get a clear view of usage, engagement, performance, and impact.
Our managed Sourcegraph Analytics service for Cody and Code Search usage data is available for:
- Sourcegraph Cloud customers
- Self-hosted customers that have fully enabled usage telemetry and are running a supported version of Sourcegraph (5.9+)
- Sourcegraph workspaces
To get started, follow our enablement instructions.
Enablement instructions
Self-hosted and Cloud
To enable Sourcegraph Analytics for self-hosted or Cloud instances:
- Create an account on Sourcegraph Accounts, or find the email address associated with your existing account.
- Contact your Sourcegraph Customer Success Manager or point of contact (or email us at support@sourcegraph.com if you don't know your contact), provide them with the email address you used to register above and ask for access to Sourcegraph Analytics.
- They will validate your account and link it to your Sourcegraph Enterprise instance's usage metrics.
- Sign in to Sourcegraph Analytics.
Customers on air-gapped deployments should reach out to their account team to discuss options.
Sourcegraph workspaces
To access Sourcegraph workspaces:
- Ensure you are an admin of your Sourcegraph workspace.
- Sign in to Sourcegraph Analytics with the same account you use for your workspace.
Data export and API
Sourcegraph Analytics includes a CSV export option with key metrics like the number of searches, chats, autocomplete suggestions, Completion Acceptance Rate (CAR%), and more. The data is split by user, day, client/editor, and programming language.
You can export data directly from the Sourcegraph Analytics web interface, or programmatically via the API. For API access and detailed instructions, see our Analytics API documentation.
Metrics
We provide a set of metrics that can be used to monitor Sourcegraph usage, engagement, performance, and impact within your enterprise.
Learn more about how we think about the ROI of Sourcegraph in our blog.
Overview metrics
| Metric | Description |
|---|---|
| Total Sourcegraph users | Total number of unique users who have used any Sourcegraph product during the selected time |
| Average daily active users | The average number of unique users who use Sourcegraph per day during the selected time |
| Total hours saved | Estimated total hours of developer time saved by using Sourcegraph, based on typical time savings per feature (editable per feature) |
| Total deep searches | Total number of Deep Search queries performed during the selected time |
| Daily active users | Chart showing the number of unique users who used Sourcegraph by day |
| Monthly active users | Chart showing the number of unique users who used Sourcegraph by month |
| Time saved | Breakdown of estimated time saved by feature (completions and auto-edits, commands, chats, searches, and code navigation), with configurable minutes-saved-per-use values |
User metrics
| Metric | Description |
|---|---|
| Total active users | Total number of unique users who have used any Sourcegraph product during the selected time |
| Average daily users | The average number of unique users who use Sourcegraph per day during the selected time |
| Average days of activity per user | The average number of days each user actively uses Sourcegraph during the selected time |
| Daily active users | Number of unique users who used Sourcegraph by day |
| Weekly active users | Number of unique users who used Sourcegraph by week |
| Daily users by product | Count of daily users across different Sourcegraph products (Cody, Code Search, Code Insights, etc.) |
| Monthly users by product | Count of monthly users across different Sourcegraph products (Cody, Code Search, Code Insights, etc.) |
| Detailed user activity | List of all active users during the selected time and their usage patterns |
Code Search and Understanding metrics
The Code Search and Understanding page is organized into five tabs: Search, Deep Search, MCP, Batch Changes, and Code Navigation.
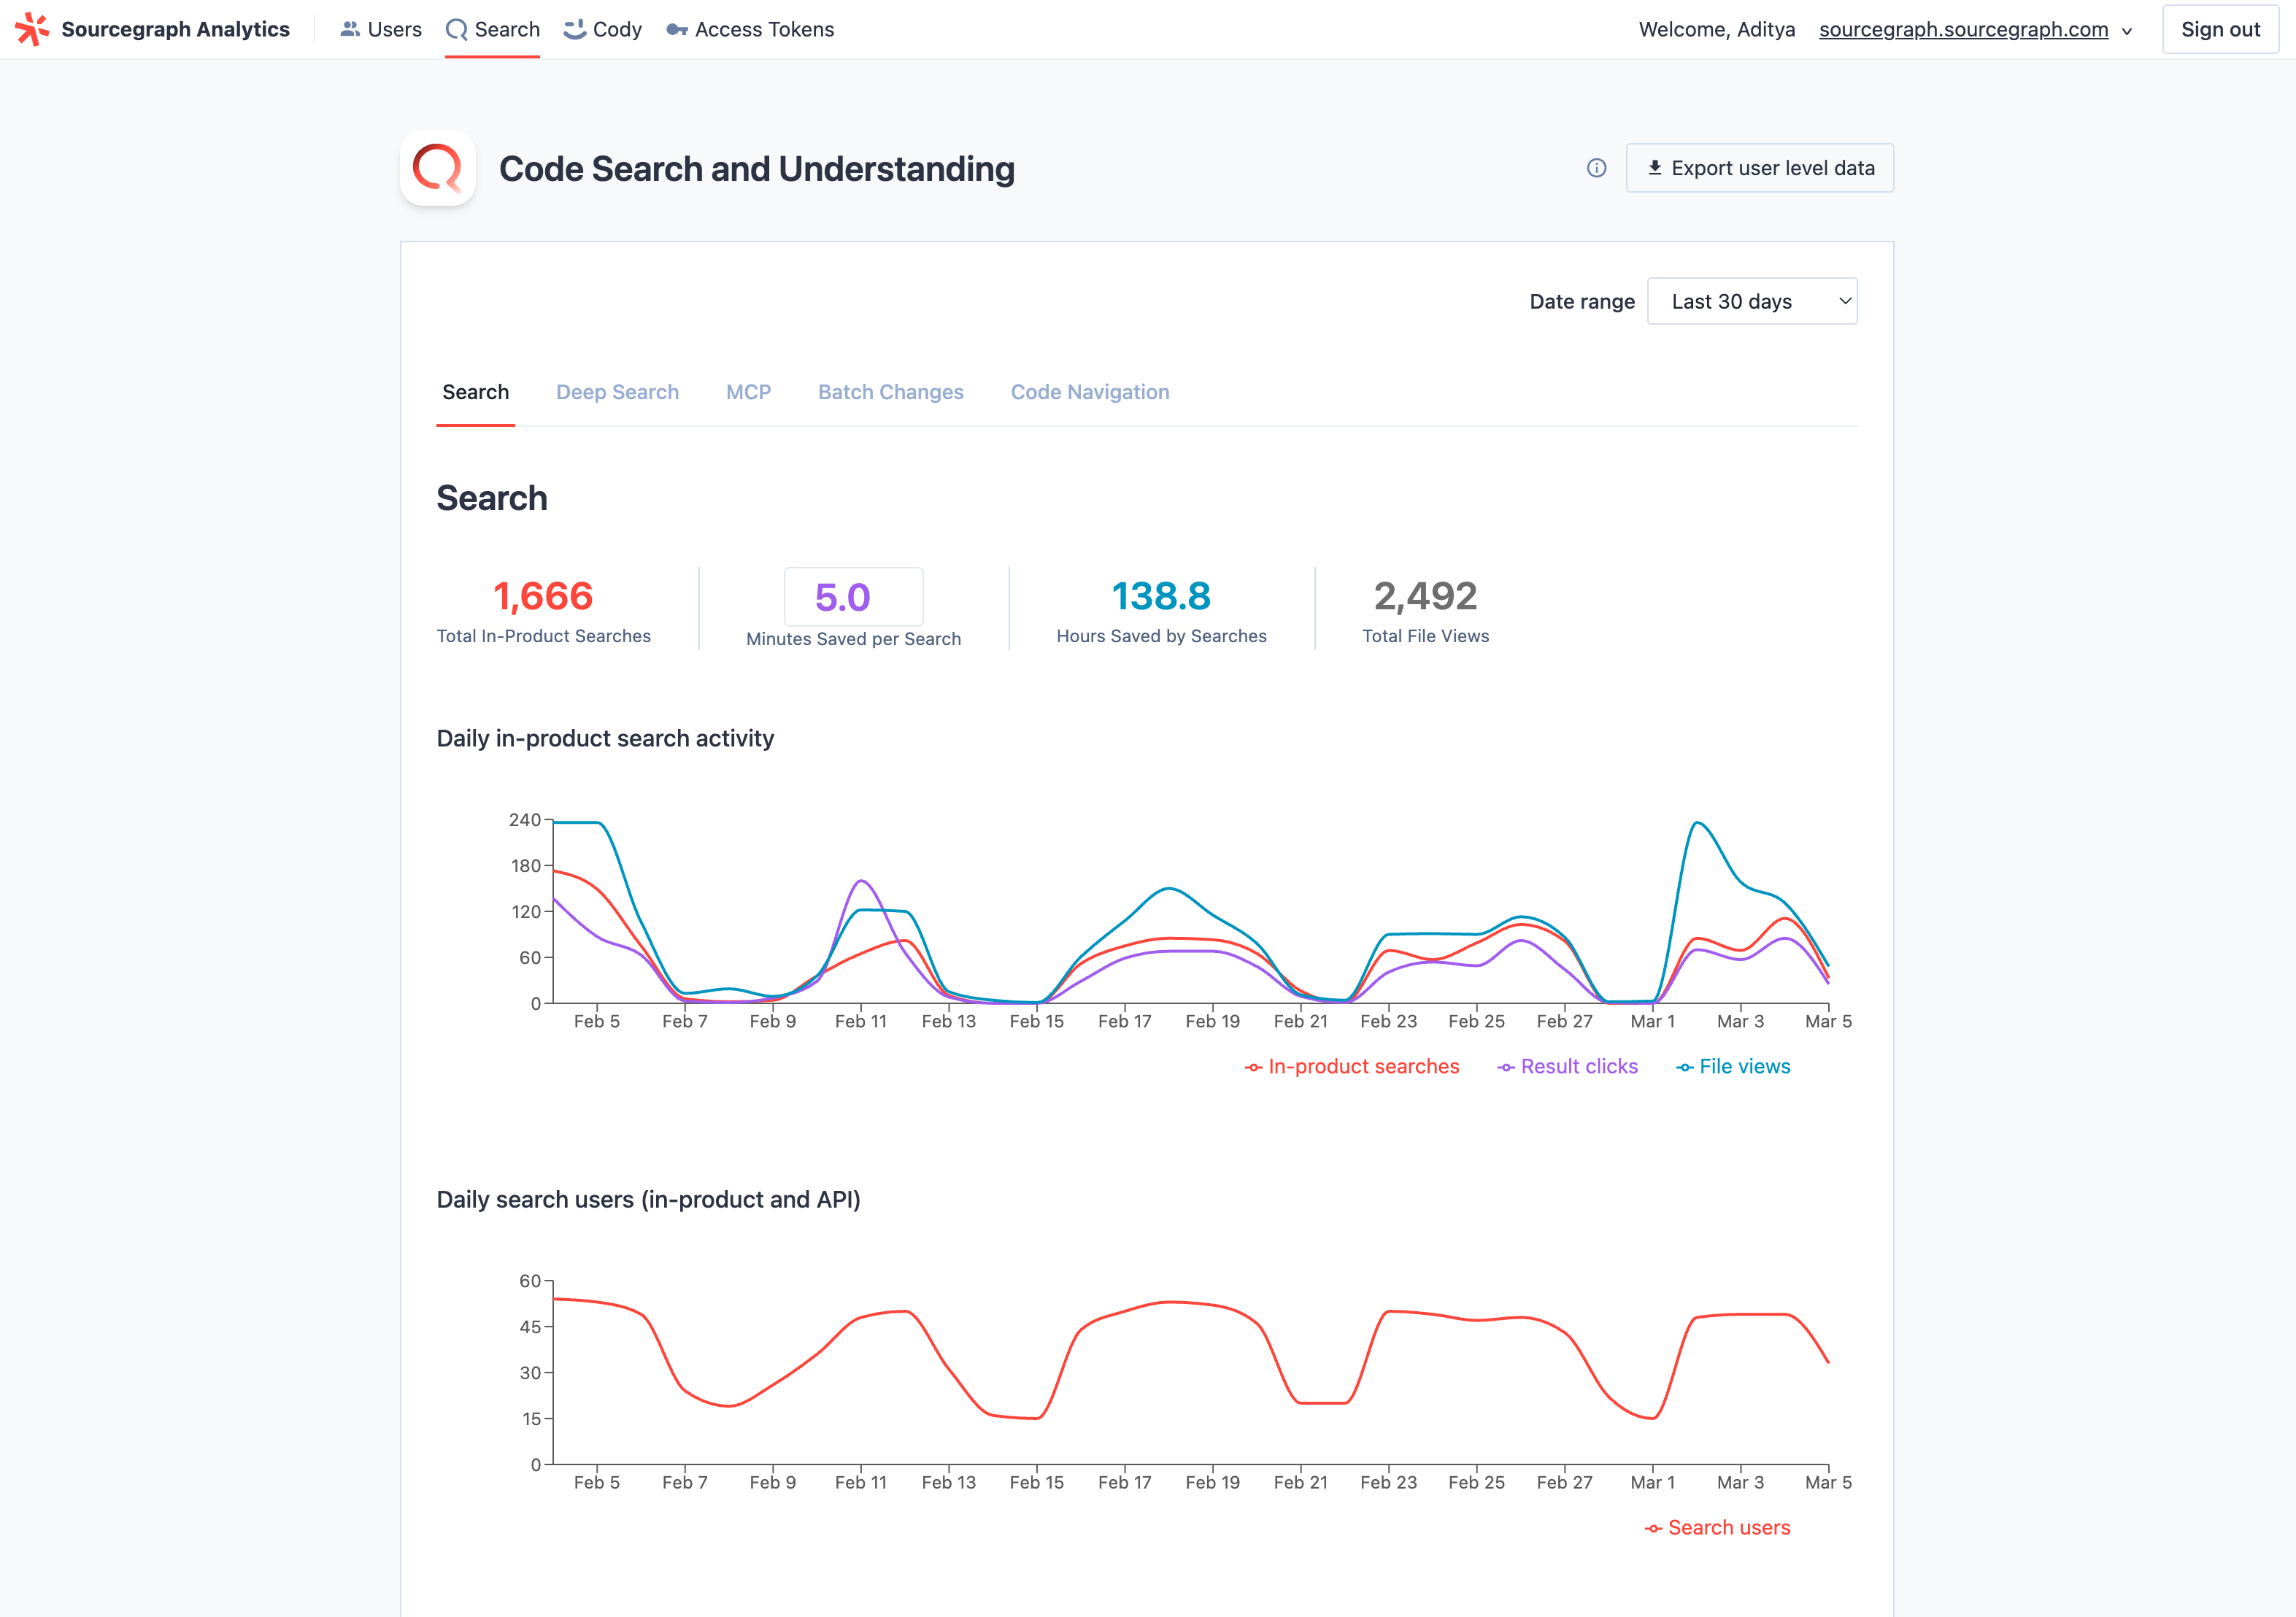
Search
| Metric | Description |
|---|---|
| Total in-product searches | Number of searches performed using the Sourcegraph search interface during the selected time |
| Minutes saved per search | Configurable estimate of minutes saved per search (default: 5 minutes) |
| Hours saved by searches | Estimated hours saved based on total searches multiplied by minutes saved per search |
| Total file views | Number of times users viewed individual files through Sourcegraph during the selected time |
| Daily in-product search activity | Chart showing in-product searches, result clicks, and file views by day |
| Daily search users (in-product and API) | Number of unique users performing searches each day, including both UI and API usage |
| All searches (in-product and API) by type | Breakdown of searches by category (Standard, Regex, Literal, Structural, Cody Context, Keyword, NLS) by day |
Deep Search
| Metric | Description |
|---|---|
| Total deep searches | Total number of Deep Search queries (initial and follow-up messages) during the selected time |
| Minutes saved per Deep Search | Configurable estimate of minutes saved per Deep Search |
| Hours saved by deep searches | Estimated hours saved based on total Deep Searches multiplied by minutes saved |
| Daily deep searches | Chart showing Deep Search queries by day |
| Monthly deep searches | Bar chart showing Deep Search queries by month |
| Daily deep search users | Chart showing daily Deep Search users and searches per user |
| Top deep search users | Searchable table of all Deep Search users with query counts, queries per day, and tool calls |
MCP
| Metric | Description |
|---|---|
| Total MCP tool calls | Total number of MCP tool calls during the selected time |
| Minutes saved per MCP tool call | Configurable estimate of minutes saved per MCP tool call |
| Hours saved by MCP | Estimated hours saved based on total MCP tool calls multiplied by minutes saved |
| MCP DAUs | Chart showing daily active MCP users |
| MCP MAUs | Bar chart showing monthly active MCP users |
| MCP usage by tool | Horizontal bar chart showing tool call counts broken down by tool name |
| Top MCP users | Searchable table of MCP users with tool call counts |
Batch Changes
| Metric | Description |
|---|---|
| Total changesets published | Total number of changesets published during the selected time |
| Minutes saved per changeset | Configurable estimate of minutes saved per changeset published |
| Hours saved by Batch Changes | Estimated hours saved based on total changesets published multiplied by minutes saved |
| Batch changes activity | Chart showing Batch Changes opened, specs created, specs executed, changesets published, and changes merged in Sourcegraph by day |
Code Navigation
| Metric | Description |
|---|---|
| Total Code Nav actions | Count of all code navigation operations performed (e.g., go-to-definition, find references) |
| Minutes saved per Code Nav action | Configurable estimate of minutes saved per code navigation action |
| Hours saved by code navigation | Estimated hours saved based on total code navigation actions multiplied by minutes saved |
| Precise Code Nav % | Percentage of code navigation actions that used precise intelligence rather than search-based results |
| Daily code navigation activity | Chart showing code navigation actions performed each day |
| Daily code navigation users | Chart showing the number of unique users utilizing code navigation features each day |
Cody metrics
The Cody page is organized into four tabs: Overview, Completions, Commands, and Chats.
Overview
Cody-specific user metrics with slightly different user definitions:
| Metric | Description |
|---|---|
| Authenticated users | All users signed in to Cody in an editor or interacted with Cody on the web during the selected period. Read more. |
| Active users | All users who sign in to Cody in an editor or interact with Cody on the web during the period selected. Read more. |
Completions
| Metric | Description |
|---|---|
| Total accepted completions & auto-edits | Count of completions and auto-edits accepted by users during the selected time |
| Hours saved | The number of hours saved by Cody users, assuming 2 minutes saved per completion and auto-edit |
| Completions and auto-edits by day | The number of completions and auto-edits suggested by day and by editor |
| Completion and auto-edit acceptance rate (CAR) | The percent of completions and auto-edits presented to a user for at least 750ms accepted by day, the editor, day, and month |
| Weighted completion and auto-edit acceptance rate (wCAR) | Similar to CAR, but weighted by the number of characters presented in the completion and auto-edit, by the editor, day, and month. This assigns more "weight" to accepted completions that provide more code to the user. |
| Completion persistence rate | Percent of completions that are retained or mostly retained (67%+ of inserted text) after various time intervals. Auto-edits are not included. |
| Average completion and auto-edit latency (ms) | The average milliseconds of latency before a user is presented with a completion or auto-edit suggestion by an editor |
| Acceptance rate by language | CAR and total completion suggestions broken down by editor during the selected time. Auto-edits not included |
Commands
As of Sourcegraph version 5.10, commands are being deprecated in favor of chat prompts. If your Sourcegraph instance is running version 5.10 or later, you may see decreased command usage.
| Metric | Description |
|---|---|
| Total command events | Total number of command executions during the selected time |
| Hours saved by commands | Total hours saved through command executions during the selected time, assuming 5 minutes saved per command |
| Cody commands by day | Daily count of command executions |
| Cody command users | Daily count of command users |
| Most used commands | Ranking of most frequently used Cody commands during the selected time |
Chats
| Metric | Description |
|---|---|
| Total chat events | Total number of chat interactions with Cody during the selected time |
| Hours saved by chats | Total hours saved through Cody chat interactions during the selected time, assuming 5 minutes saved per chat |
| Cody chats by day | Daily count of chat interactions |
| Cody chat users | Daily count of chat users |
| Lines of code inserted | Lines of code generated by Cody in chat that get applied, inserted, or pasted into the editor. Only VS Code is included in this metric for now |
| Insert rate | Percent of code generated by Cody in chat that gets applied, inserted, or pasted into the editor. Only VS Code is included in this metric for now |
| Chat apply & insert persistence rate | Percent of code inserted by Apply and Insert actions that are retained or mostly retained (67%+ of inserted text) after various time intervals |
| Prompts created, edited, and deleted by day | Daily count of prompt management activities, including creation, modification, and removal |
| Users creating, editing, and deleting prompts by day | Number of unique users performing prompt management activities each day |
CSV export
You can download underlying user activity data from Sourcegraph Analytics as a CSV export. To do this, click the Export user-level data button at the top right of any tab within the portal.
When exporting, you can group the data by:
- User
- User and month
- User and day
- User, day, client, and language
And you can select the timeframe for the export using the startDate and endDate parameters (with YYYY-MM-DD values).
Each row in the CSV represents a user's activity for a specific combination of these groupings (e.g., a particular day, month, client, and/or language). The CSV includes metrics such as searches, code navigation actions, chat conversations, code completions, and more.
Important Notes
- Not all billable actions are included: Some Sourcegraph features, such as code monitors and batch changes, are not yet represented as columns in the CSV export. We plan to add these fields soon. If a user engages with these features, their activity may appear as a “blank” row in the export. If a user is listed as an “Active Sourcegraph User” (see column D), but the rest of the row is blank, they performed a billable action that isn’t currently tracked in the CSV
- A zero or blank value in a row can also mean that the user did not perform tracked actions for that specific date, client, or language
| Column Name | Description |
|---|---|
| Instance user ID | Unique identifier assigned to each user in the system. |
| User Email | Email address associated with the user's account. For self-hosted instances, customer must sign the user metadata export addendum for this column to populate. |
| Username | User's login identifier, usually matches the username from the auth provider (e.g., GitHub). For self-hosted instances, customer must sign the user metadata export addendum for this column to populate. |
| Active Sourcegraph User | Indicates if the user activity in this row is considered billable. Read more. |
| Client Name | Name of the client application or interface used. Common values: - [IDE_name].cody: Cody extension interactions from IDEs. - server.web: Interactions with the web interface (e.g., searches, code navigation, insights, and some chat events). Variations like server.svelte-web may exist. |
| Timestamp Date (or Month) | When the activity was recorded. |
| Language | Programming language of the interaction. This is only recorded for a subset of events, mostly completion and code navigation, and will therefore be blank for many rows. |
| Searches | Number of search queries performed by the user in the web UI. Searches via other methods (e.g., API) are not captured here. |
| Code Navigation Events | Number of times the user navigated through code structures (e.g., "find references", "go to definition"). |
| Code Insight Views | Number of times a code insight was viewed. |
| Chat Events | Number of Cody chats executed. |
| Command Events | Number of Cody commands executed. |
| Combined Completion Suggestions | Number of code completion suggestions offered. |
| Combined Completion Acceptances | Number of code completions accepted by the user. |
| Total Accepted Char Count | Sum of characters from the user’s accepted code completions (includes both full and partial acceptances). |
| Combined CAR | Completion acceptance rate (ratio of accepted to suggested completions), combined across editors. |
| Weighted CAR | Similar to CAR, but weighted by the number of characters presented in the completion. Gives more weight to accepted completions with more code. |
| Total Characters Written by Cody | Inserted code that Cody generates via chat, prompt responses, accepted autocompletions, or suggestions/fixes. Used as the numerator in the "Percentage of Code Written by Cody" ratio. |
| Total Characters Written | Total new code inserted into the editor (includes both user-generated and Cody-generated characters). Used as the denominator in the "Percentage of Code Written by Cody" ratio. |
| Percentage of Code Written by Cody | Measures Cody's impact: (Total Characters Written by Cody ÷ Total Characters Written) × 100. Learn more about this metric. |
| Auto-edit suggested events | Number of Cody auto-edit suggestions offered. |
| Auto-edit accepted events | Number of Cody auto-edit suggestions accepted by the user. |
| Auto-edit acceptance rate | Ratio of accepted to suggested auto-edits, combined across editors. |
| Lines changed by chats and commands | Number of lines of code (LOC) changed by chat and command events. |
| Lines changed by completions and auto-edits | Number of lines of code (LOC) changed by completion and auto-edit events. |
Architecture
Learn about how Analytics and Telemetry fit into Sourcegraph in the architecture overview.