GopherCon 2019 - Optimizing Go Code without a blindfold
Colin King for the GopherCon 2019 Liveblog
Presenter: Daniel Martí
Liveblogger: Colin King
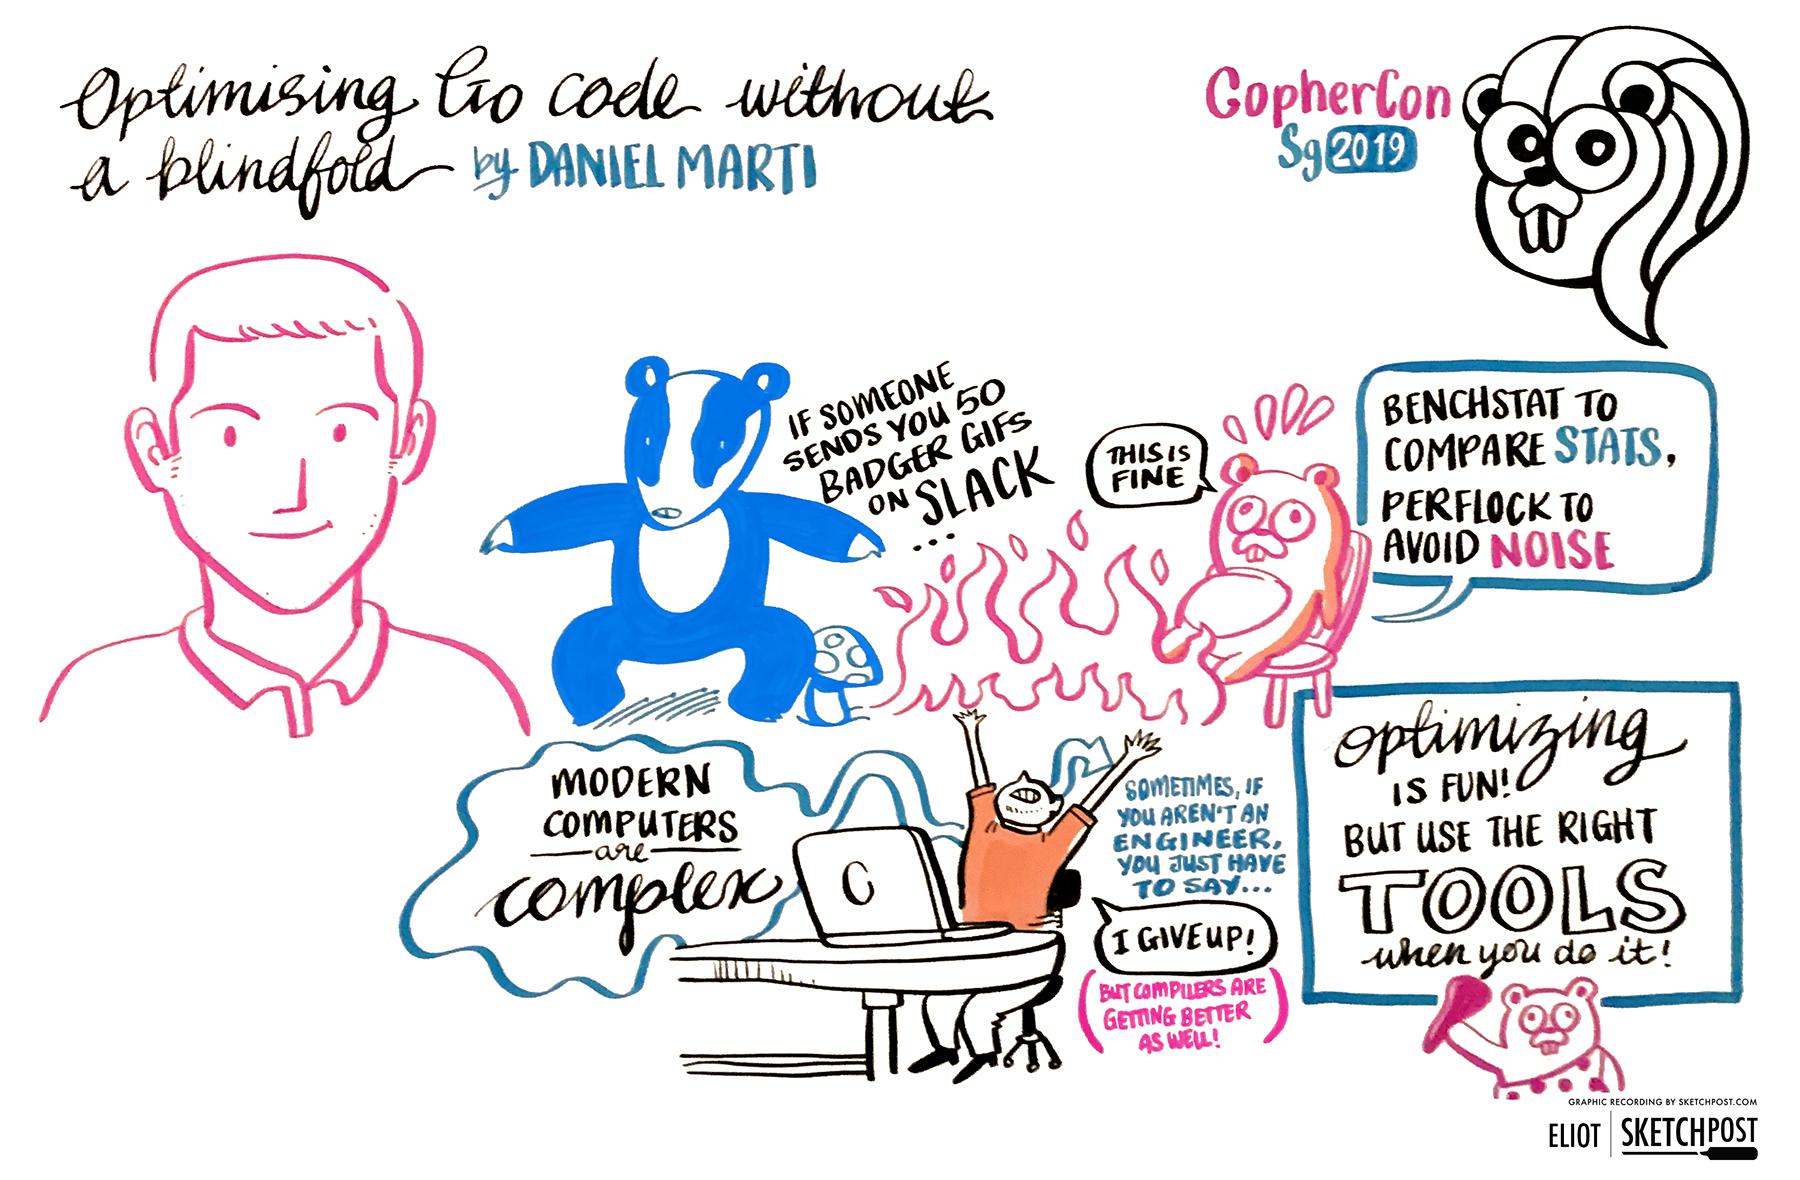
Illustration by Sketch Post
Overview
Making code faster is exciting, and benchmarks in Go make that easy to do! Not really. Optimizing a program can be complex and requires careful consideration to do so properly. This session will demonstrate techniques and tools which are a must for any performance aficionado.
Go Benchmarks
Do you know if your code is slow? Do you want to know if it can go faster? If so, the first tool you may want to reach for is benchmarking.
The Go standard testing library includes tooling for benchmarking your code to measure its CPU and memory consumption. Let's look at a simple example:
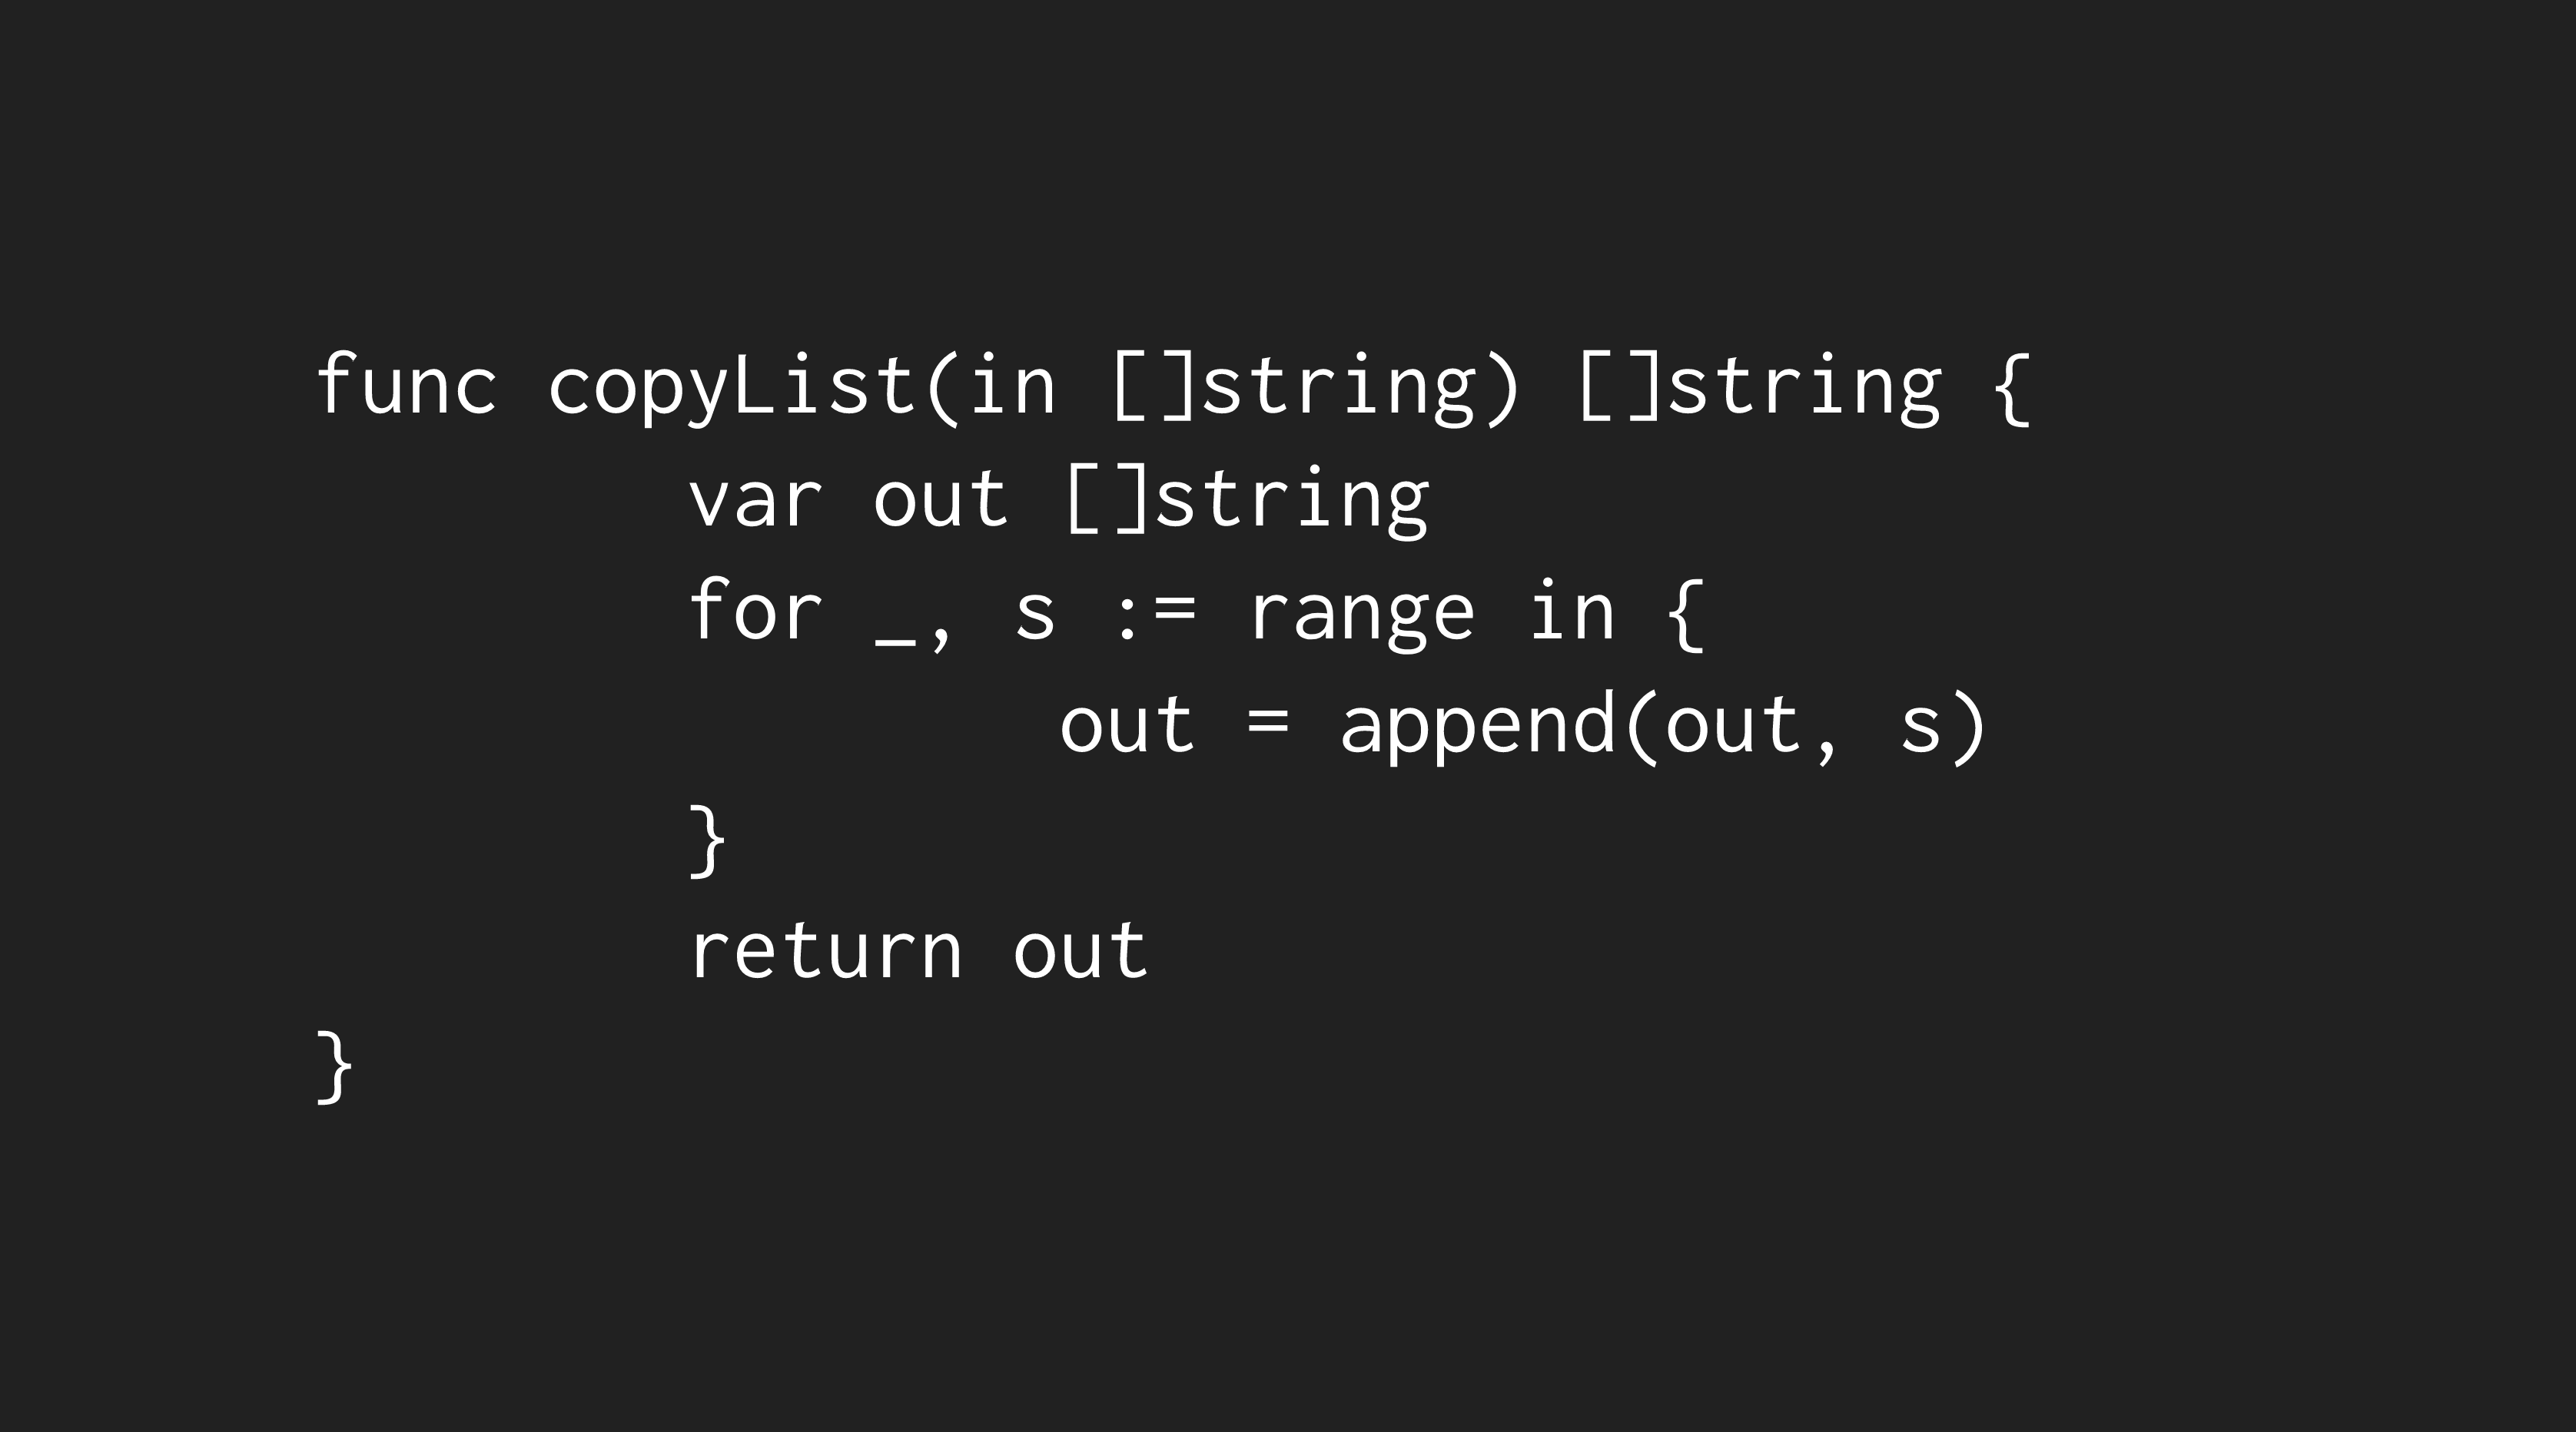
You could then benchmark this utility function like so:
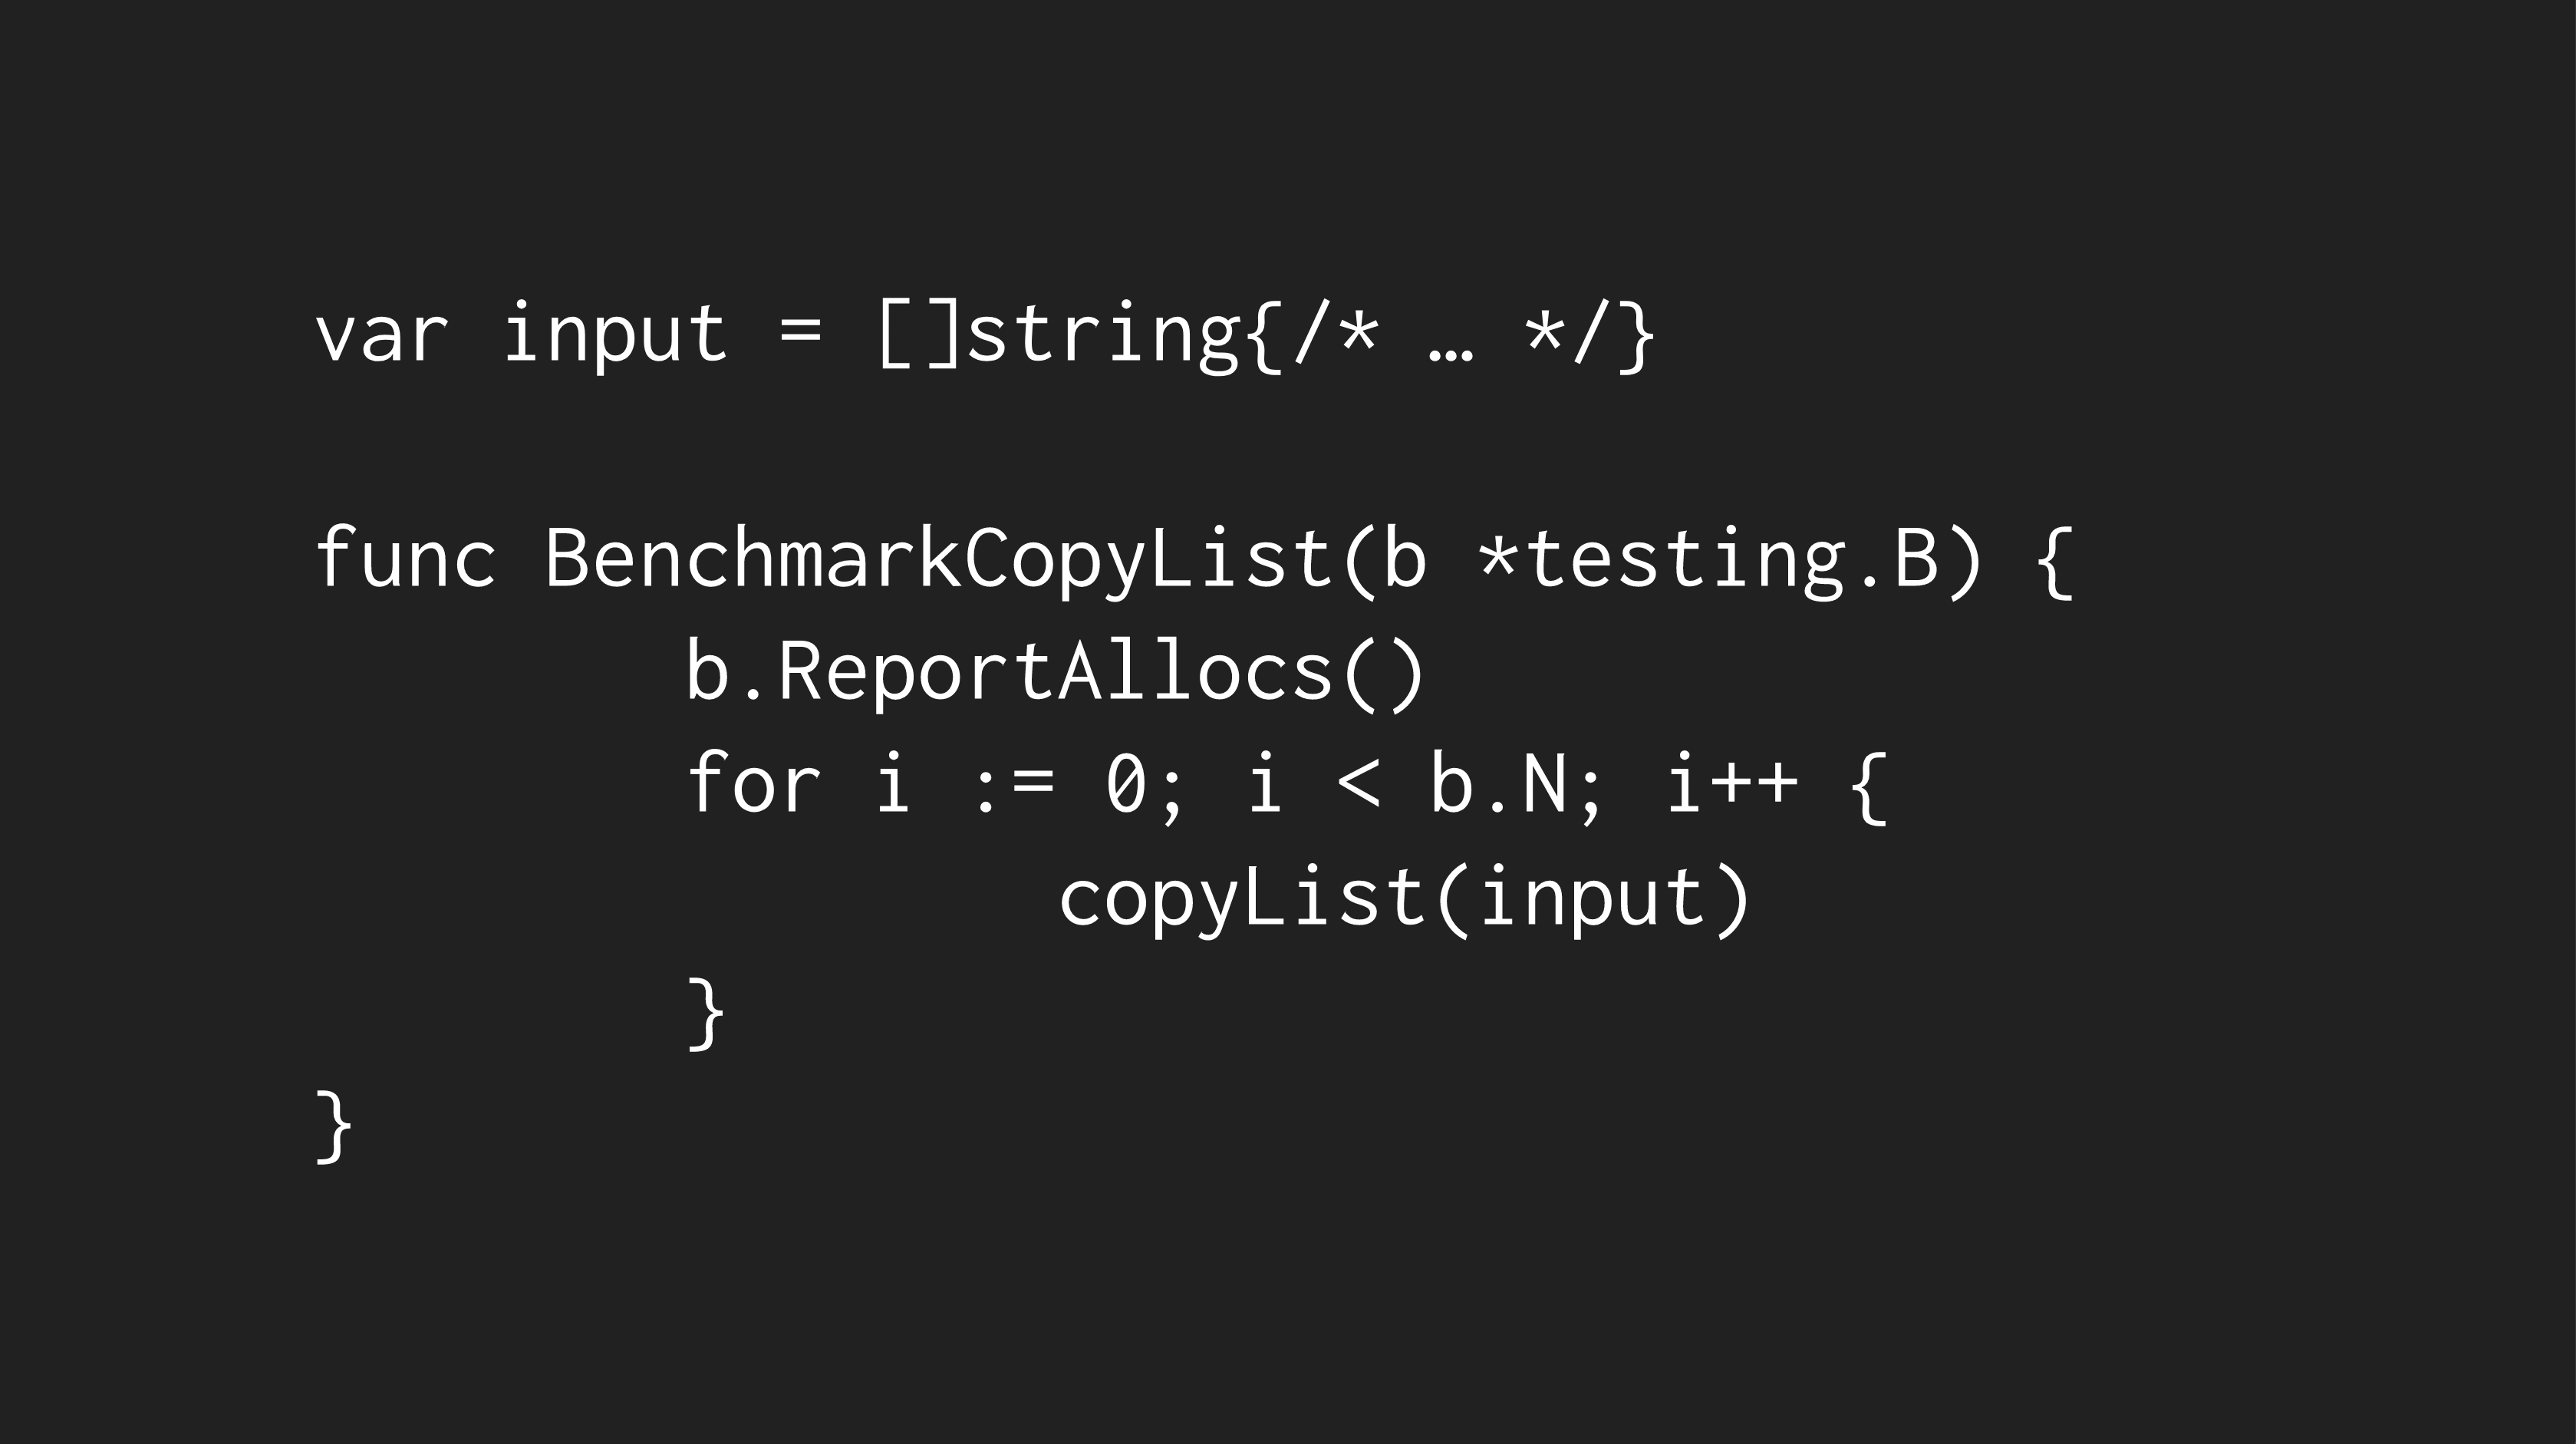
From the test below, we can see that this simple function takes about 5,000 nanoseconds per call, along with quite a few allocations:
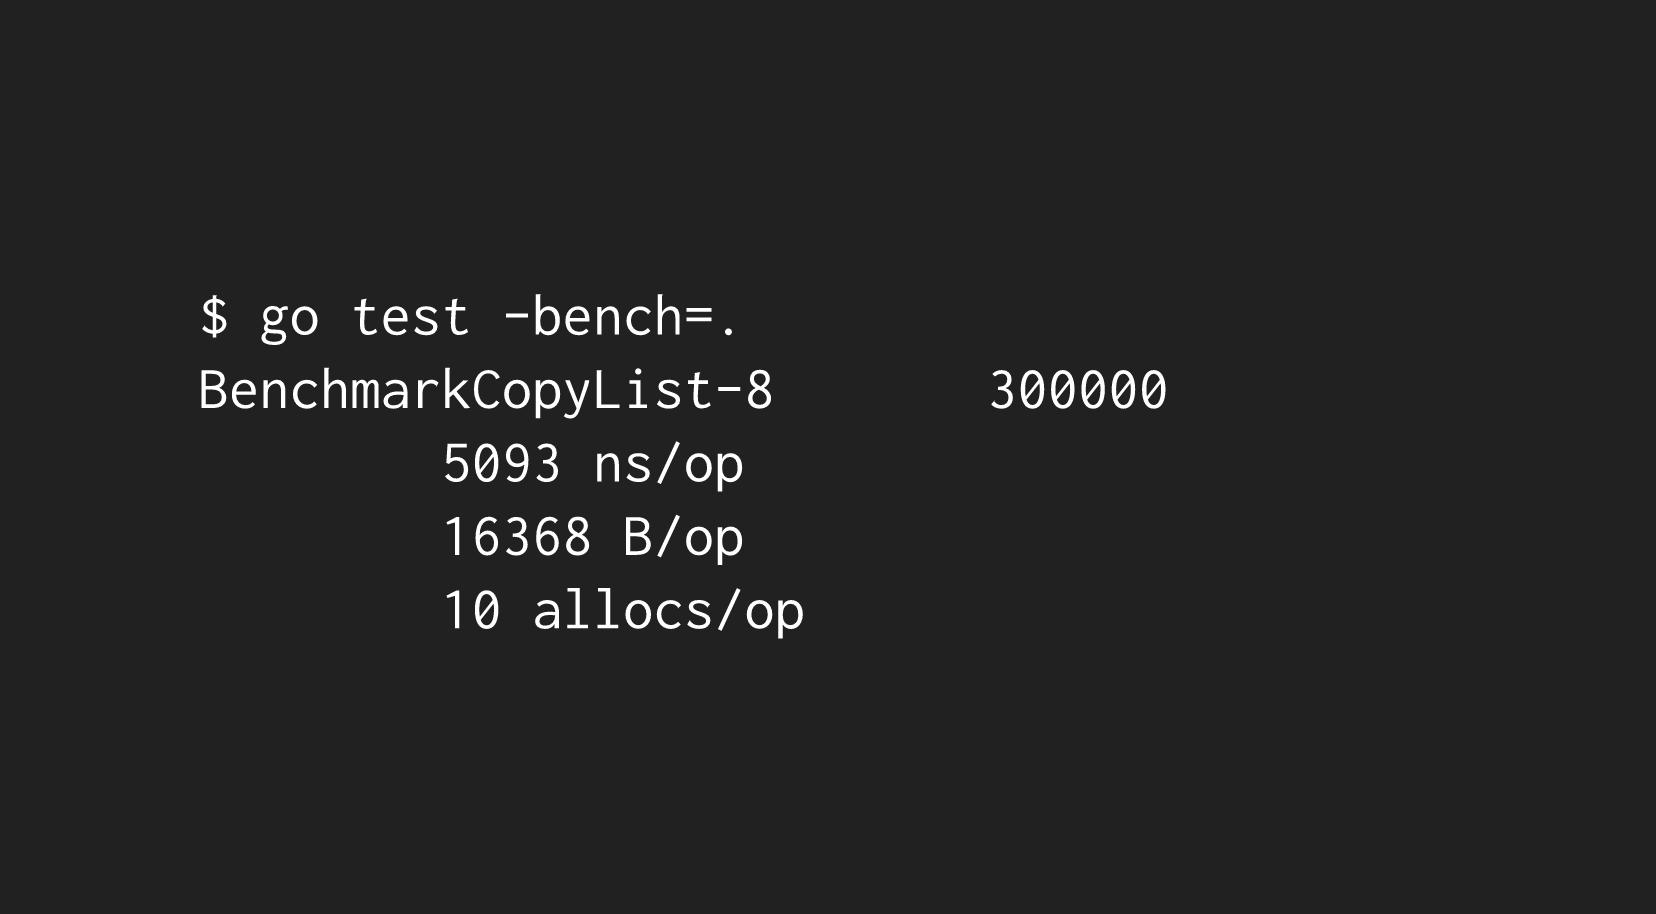
Can we do better? To find out, we can reach for pprof to identify which lines are so problematic:
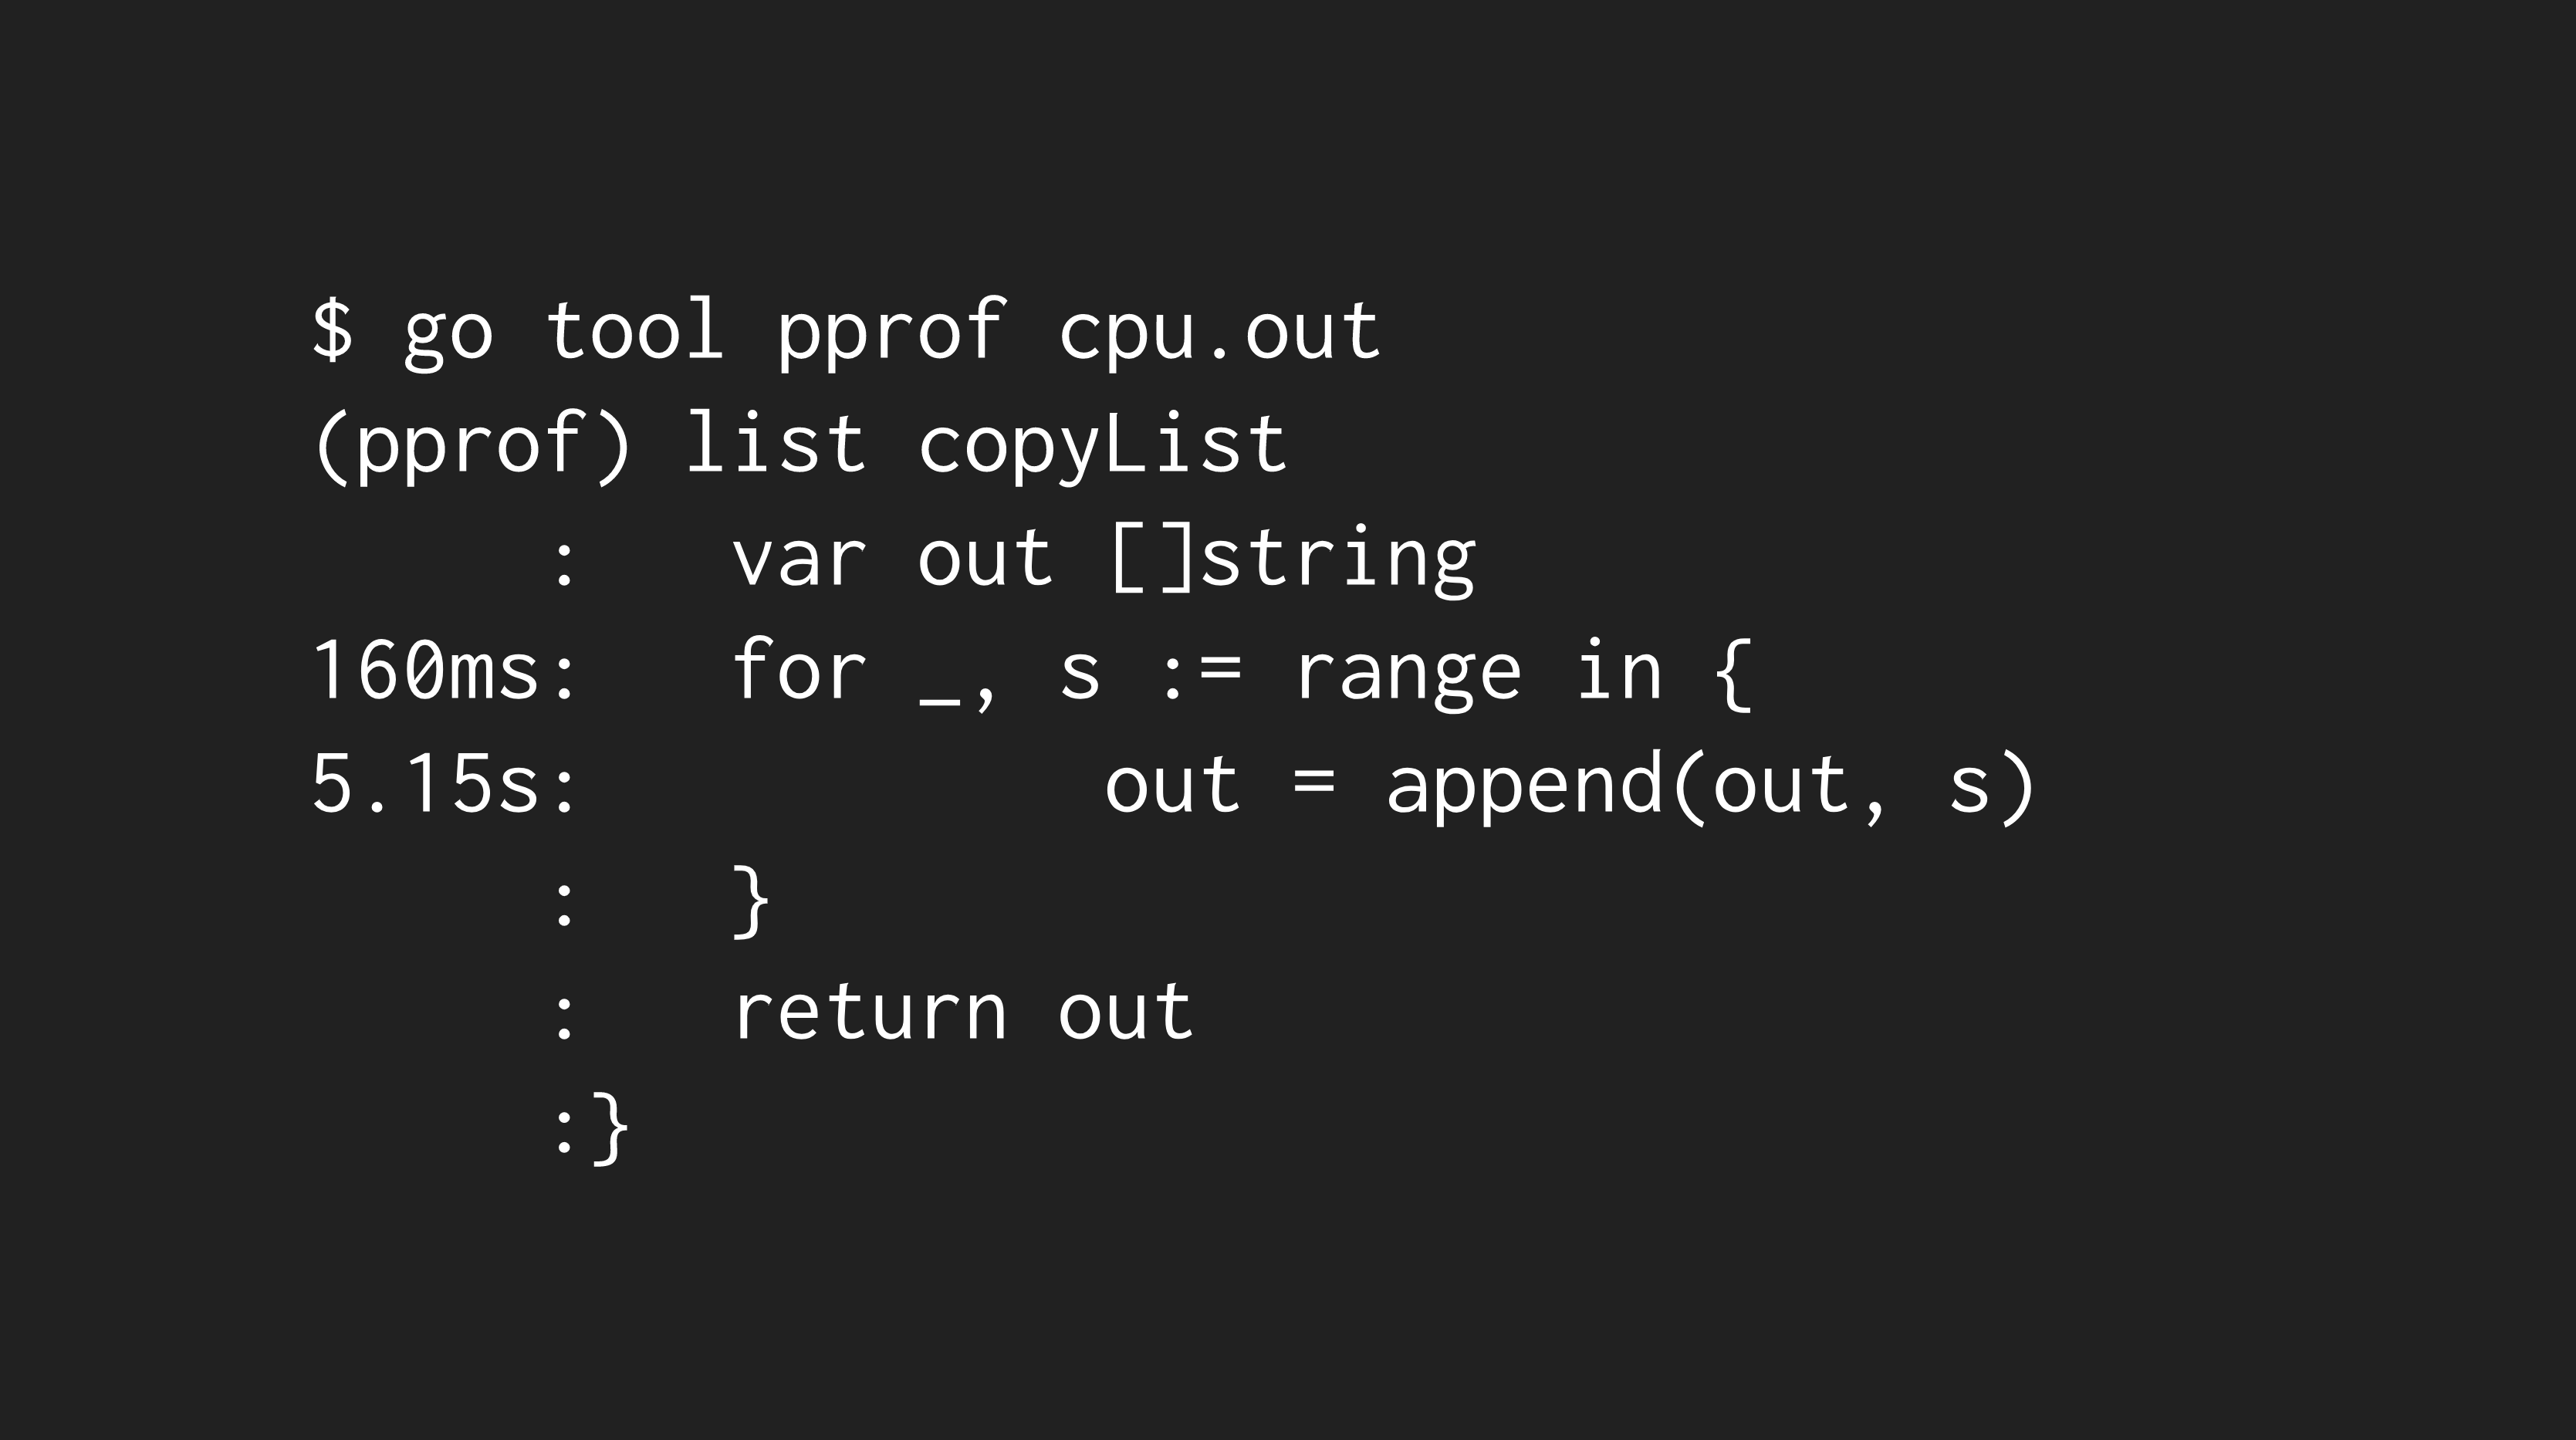
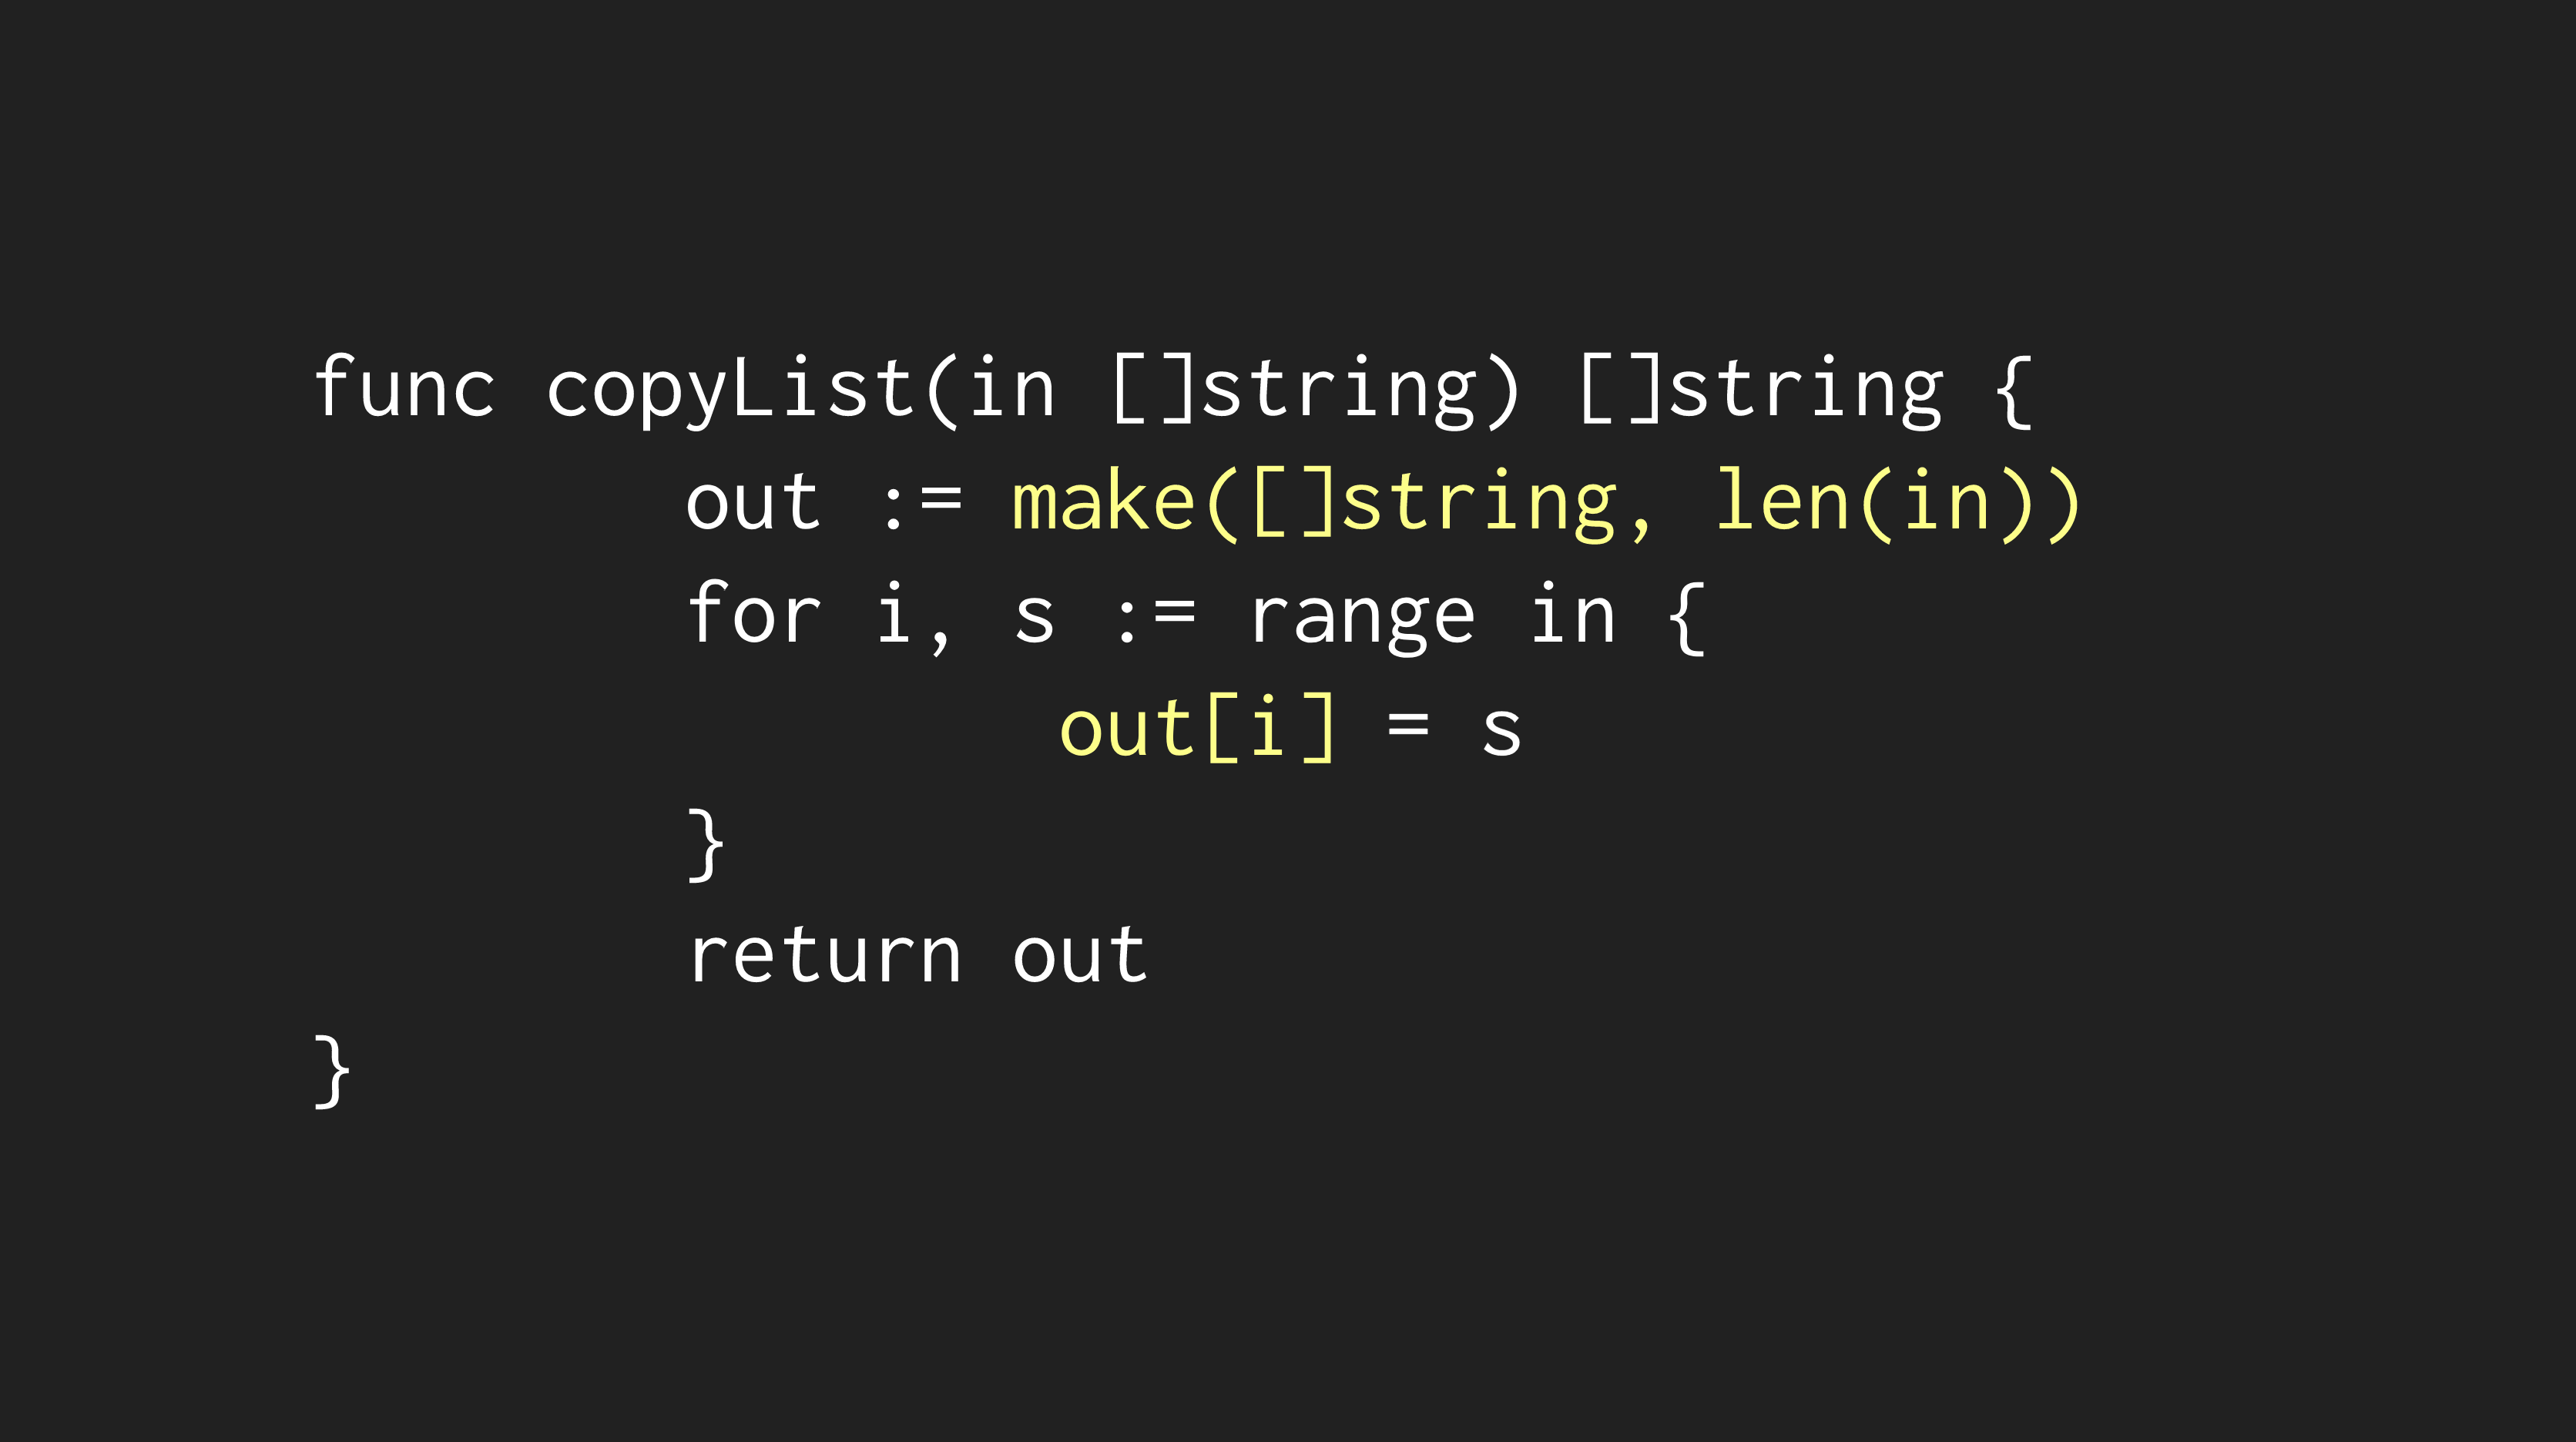
From above, we can see that our benchmark is spending the majority of its time performing append operations! Thankfully, there's an easy fix by pre-allocating the slice and setting each element:
To understand how much we improved on our benchmark test, we can introduce another tool -- benchcmp -- which displays the performance changes between two executions of the same benchmark test:
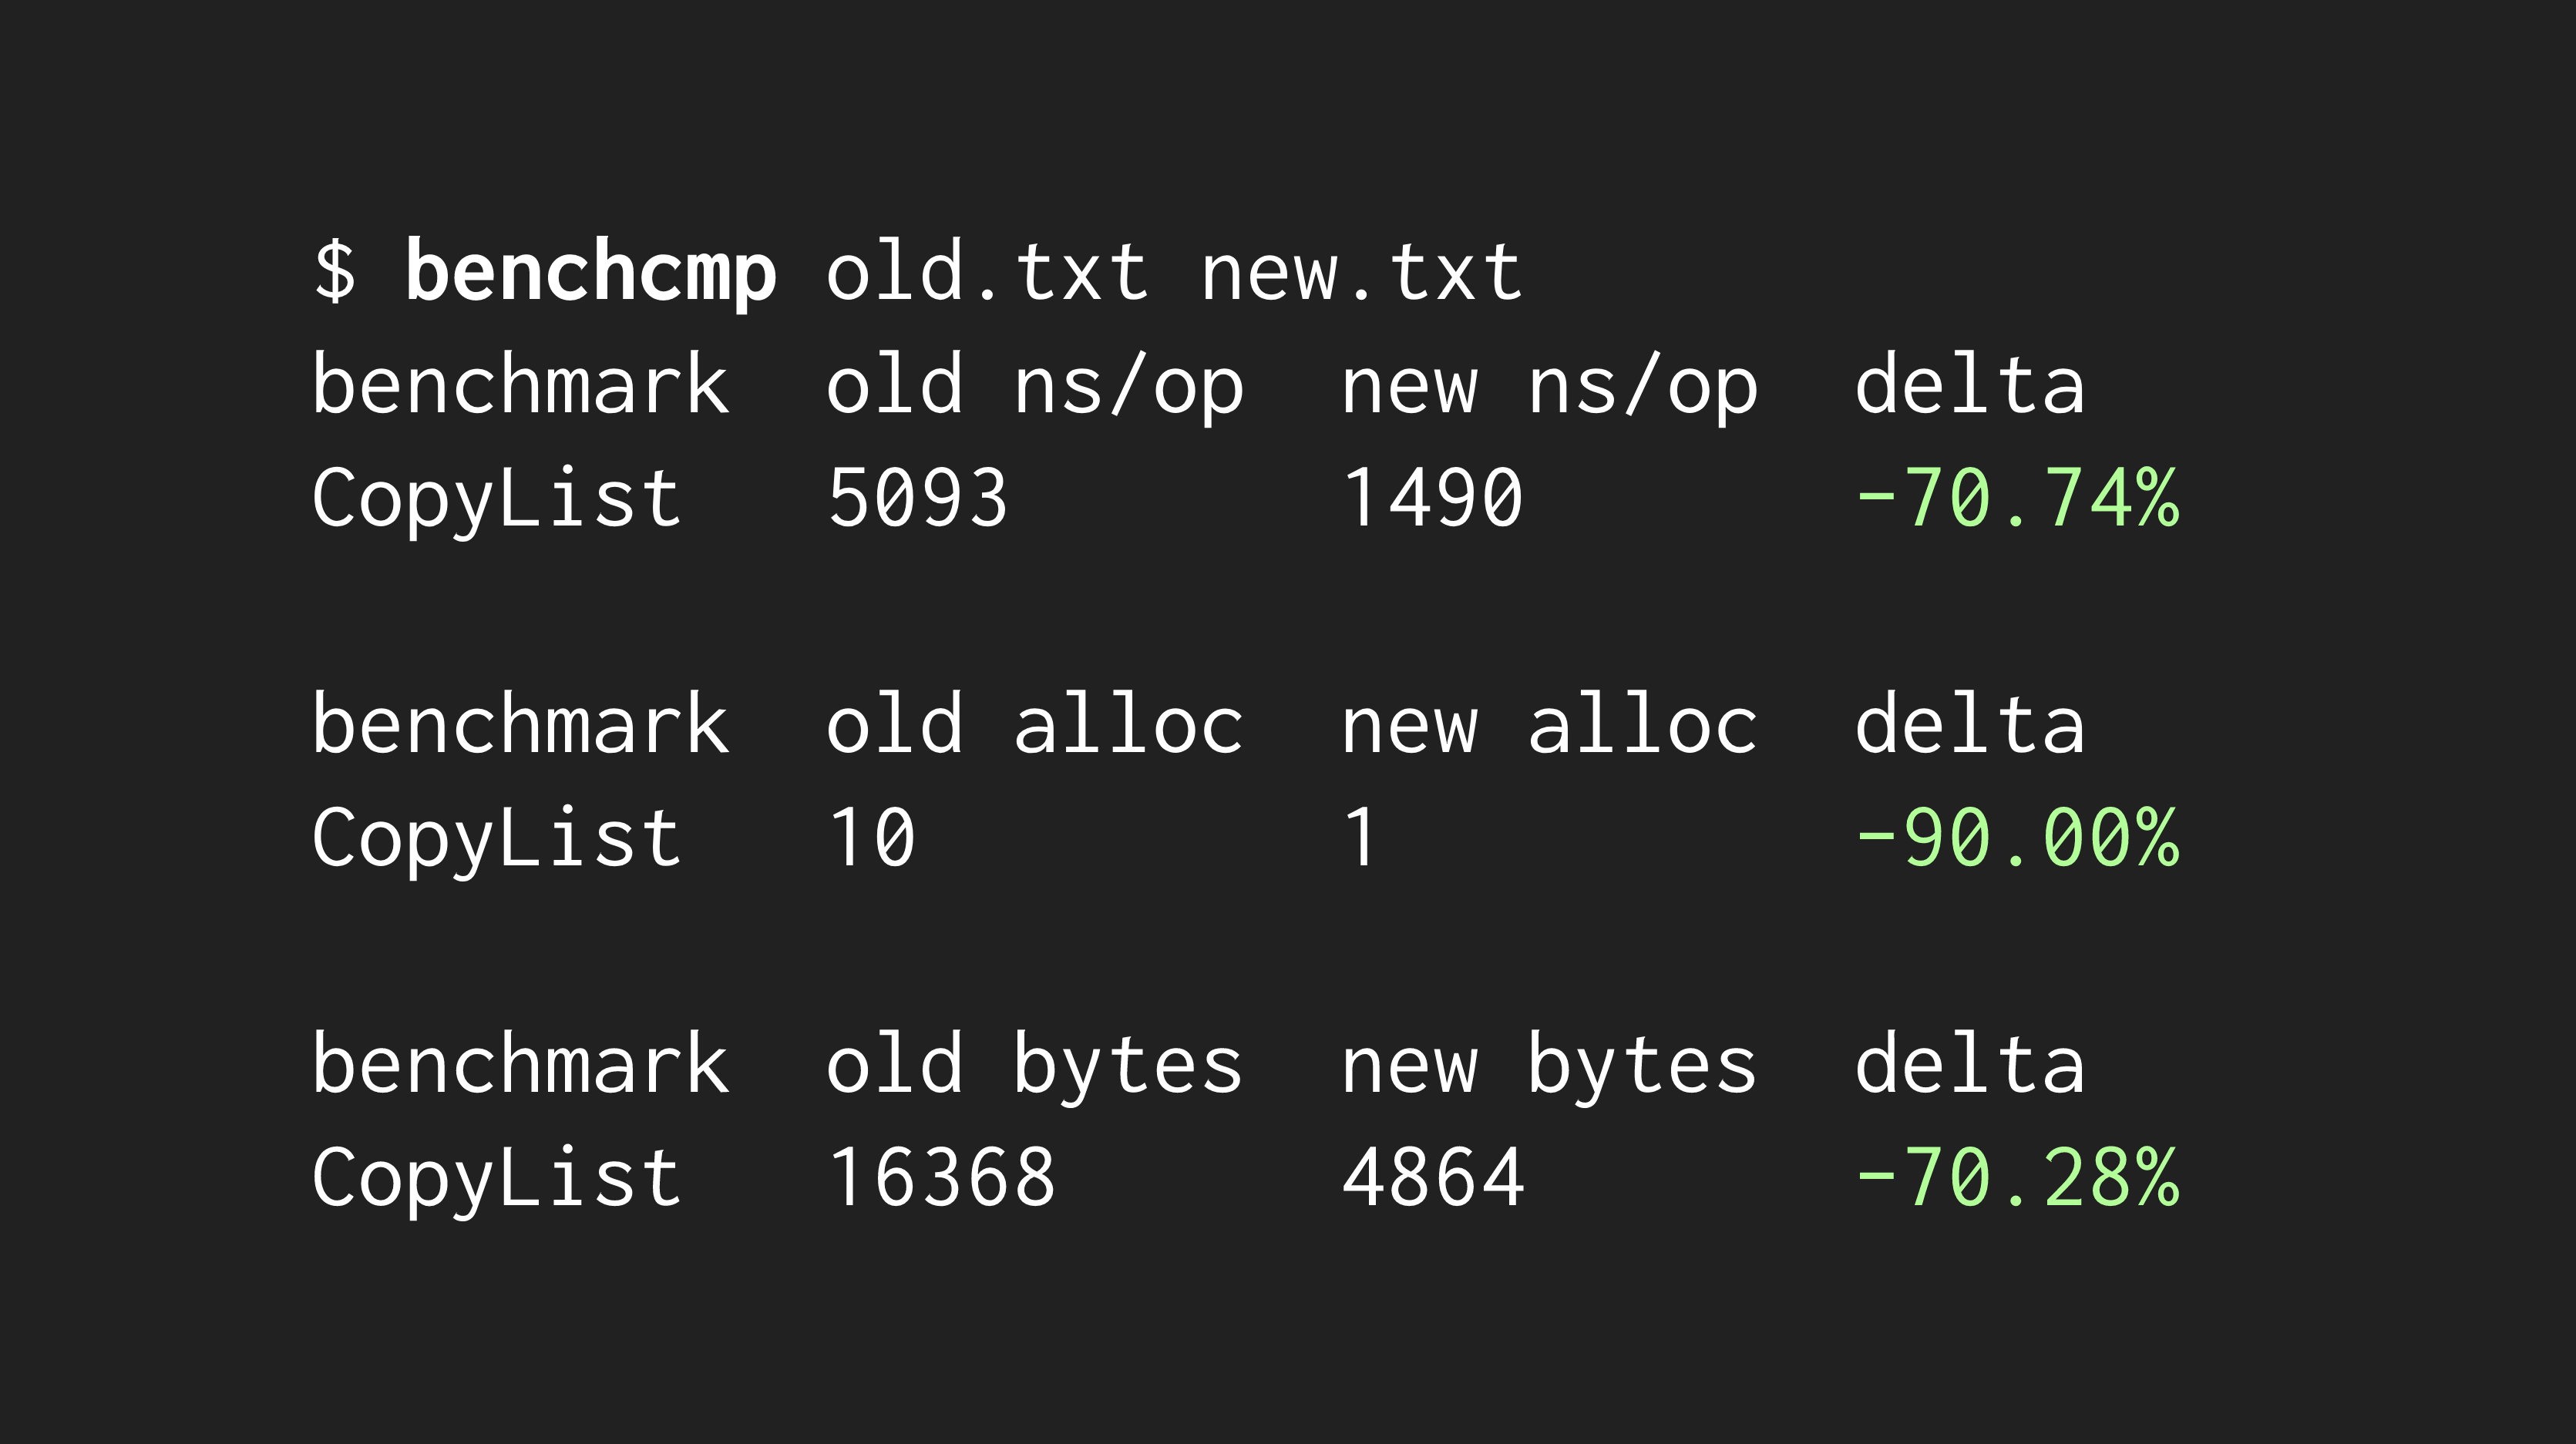
🎉Woohoo!! 🎉 That's a massive performance improvement.
But, can you trust your benchmarks?
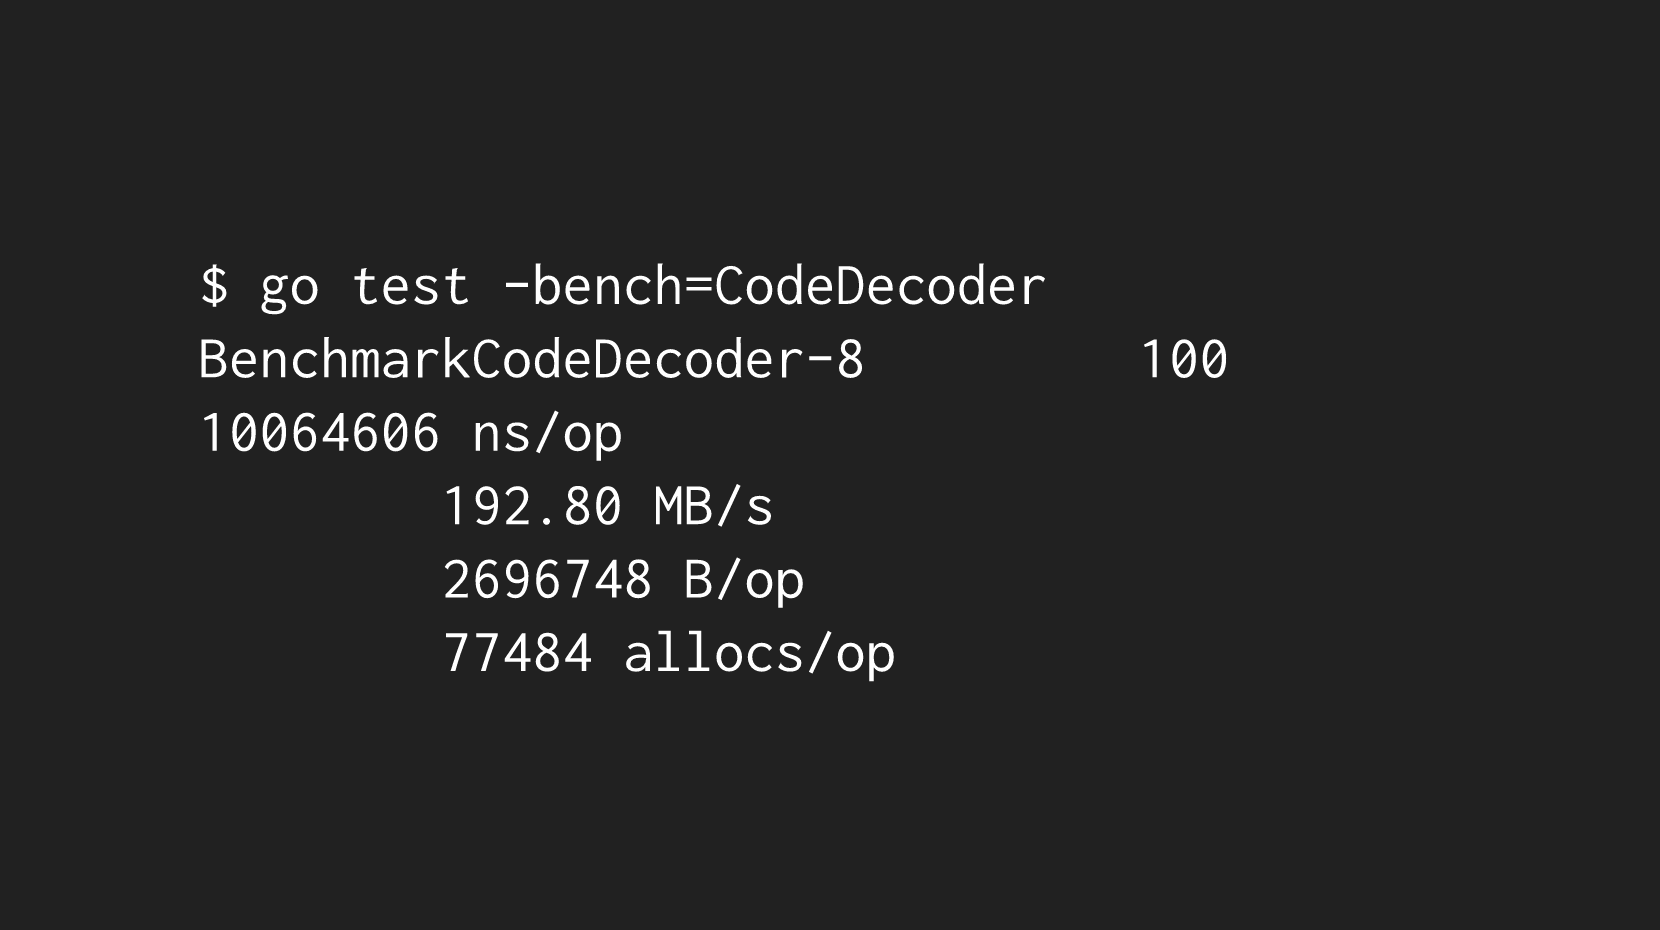
While the example in the previous section was simple, the production code we want to benchmark tends to be more complex. Let's look at a more resource-intensive example by checking out the benchmark tests used by the standard library's encoding/json package. Specifically, we'll look at the BenchmarkCodeDecoder test.
If you run this test a few times, you'll notice that the performance measurement varies with each run:
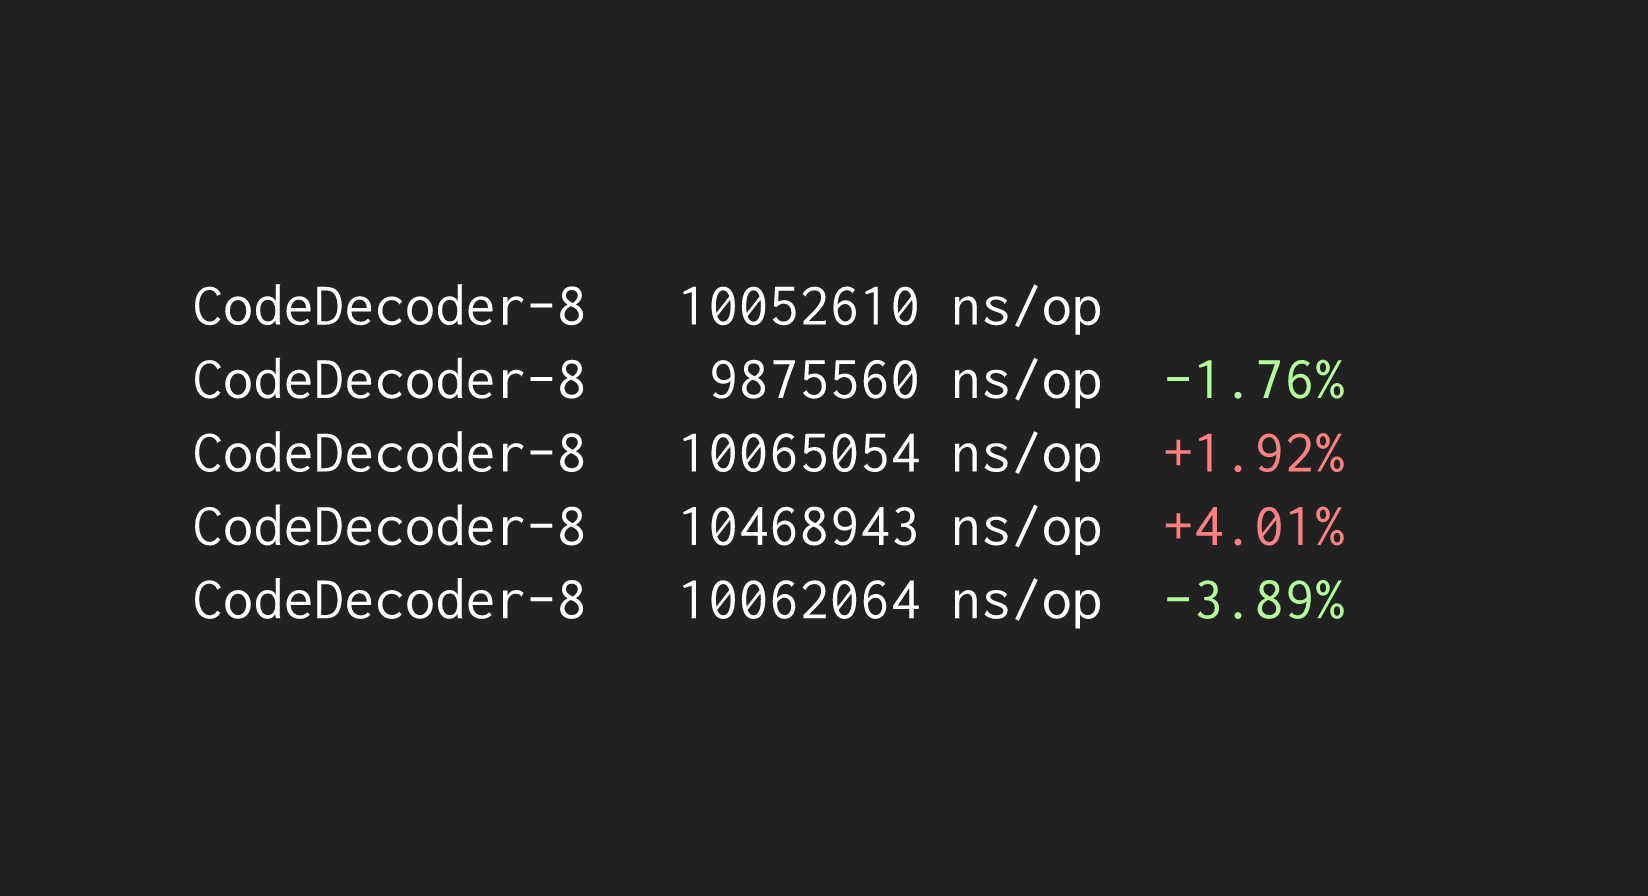
While a +/-3% difference may not seem like it's worth losing sleep over, packages like encoding/json regularly see minor speed improvements -- in fact, three of the last four performance improvements for encoding/json were under 4%. With this much noise, how can we reliably identify if a change has meaningfully impacted the performance of a package?
For that, we're going to need some statistics.
Benchmarks / Statistics
To understand the true performance characteristics of a package, we'll want to look at multiple executions of our benchmarks, so we can compute the mean and variance. For that, we can use the benchstat command:
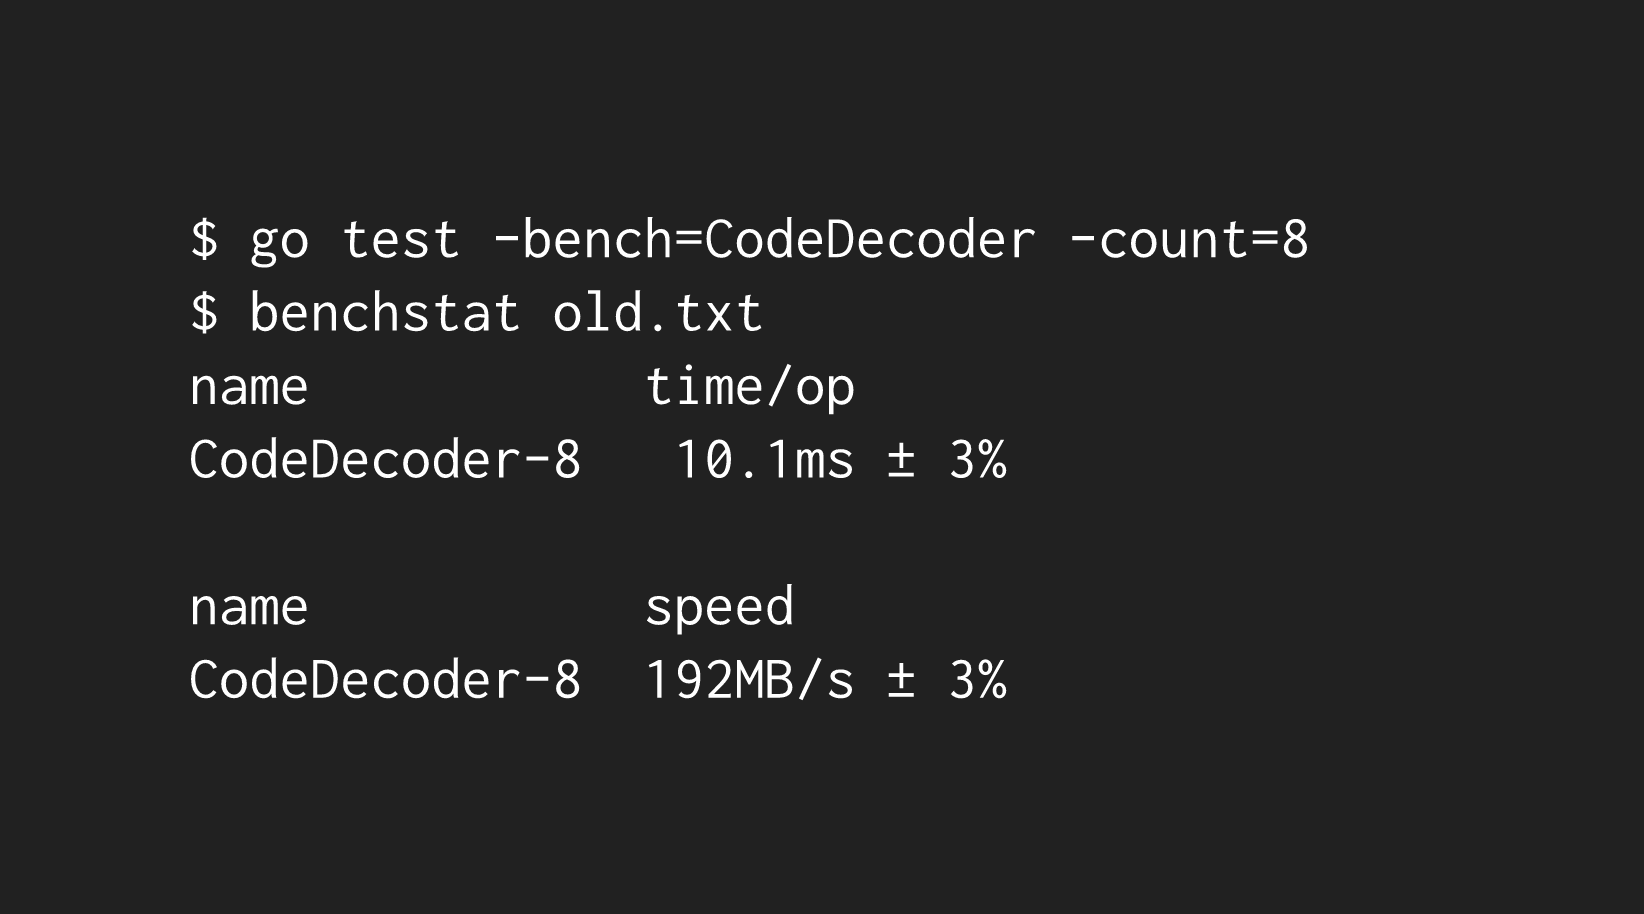
3% of variance is still rather high. To reduce that, we're going to have a look at what else your CPU is up to. Ideally, your CPU is as close to 0% as possible, since your benchmark tests will happily use up as much CPU as possible. However, to be realistic, you are probably at work with Slack, an editor and 20+ Chrome tabs open. (Fun fact: animated emojis used to be huge CPU hog in Slack)
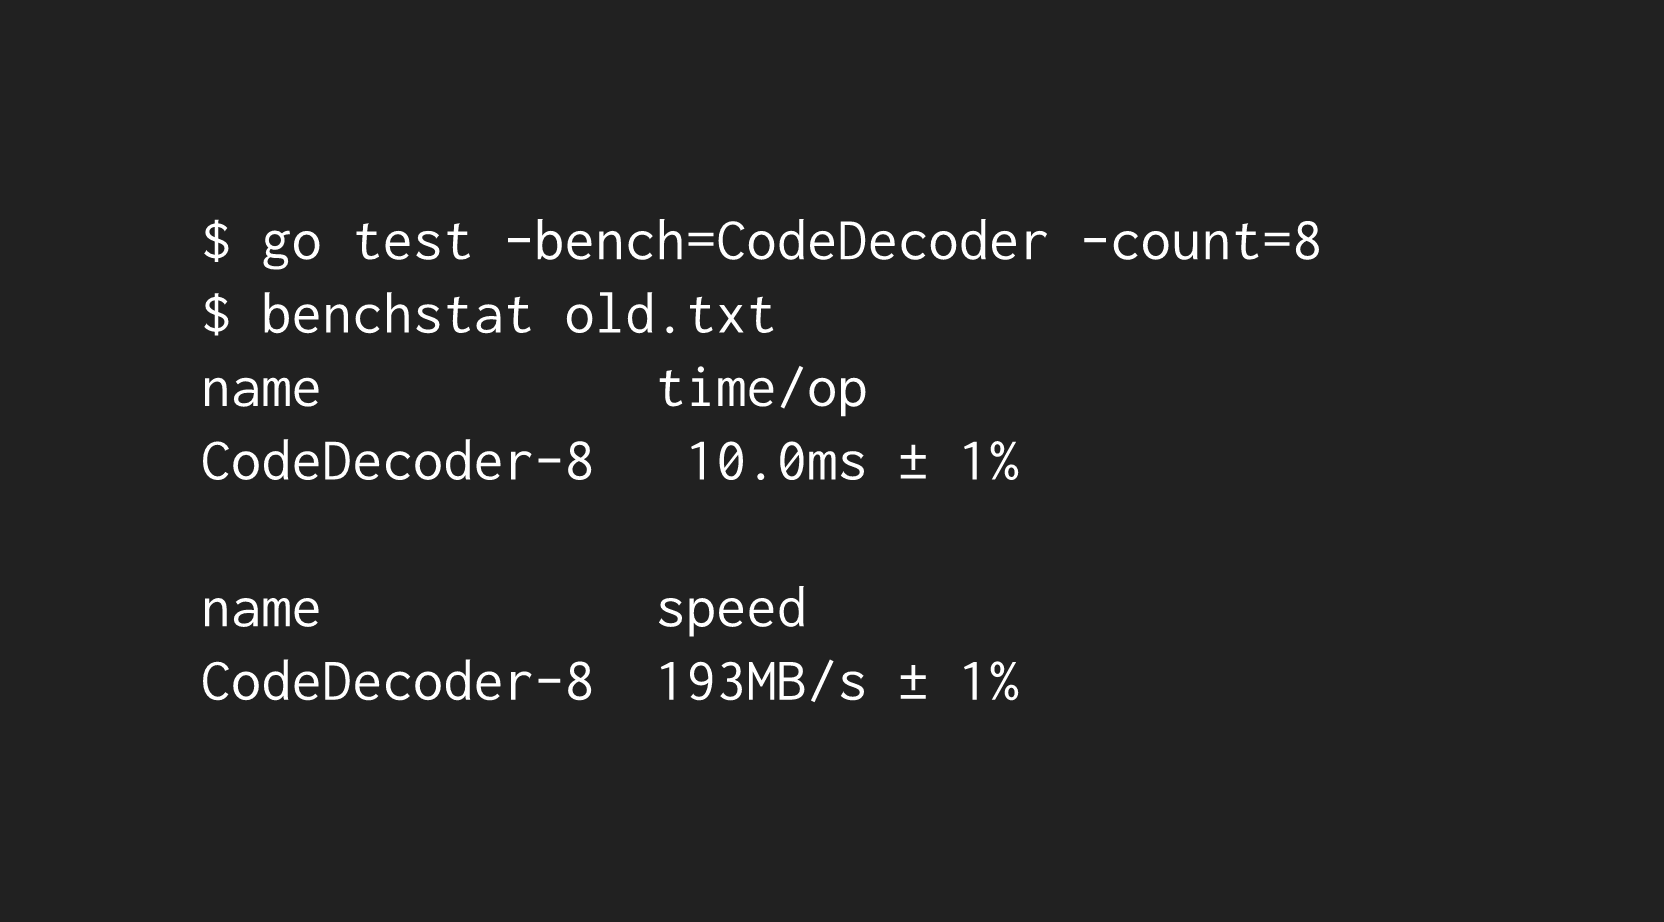
Closing these resource-hungry apps was enough to drop our variance down to +/-1%:
However, that's not where our CPU problems stop. If you run a benchmark a few times in a row, you might notice a major drop in performance, for no apparent reason:
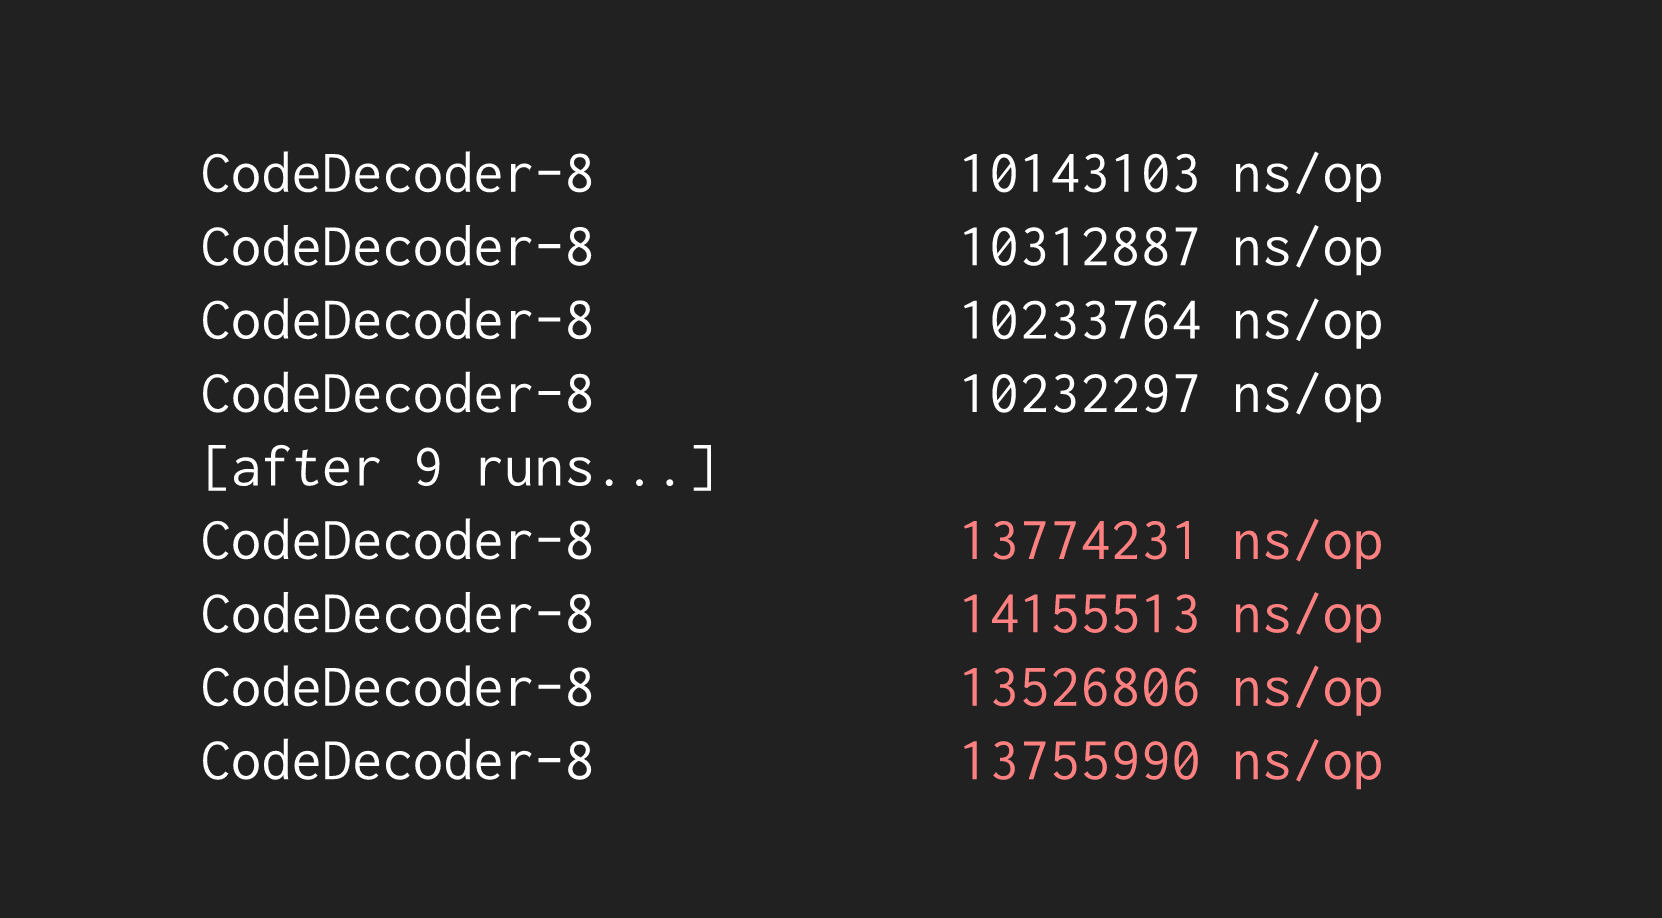
In this case, it's due to CPU throttling since the above benchmarks have pegged the CPU usage at 100% for too long. Thankfully, there's another tool -- perflock -- we can introduce to prevent our benchmarks from using too much CPU at once:
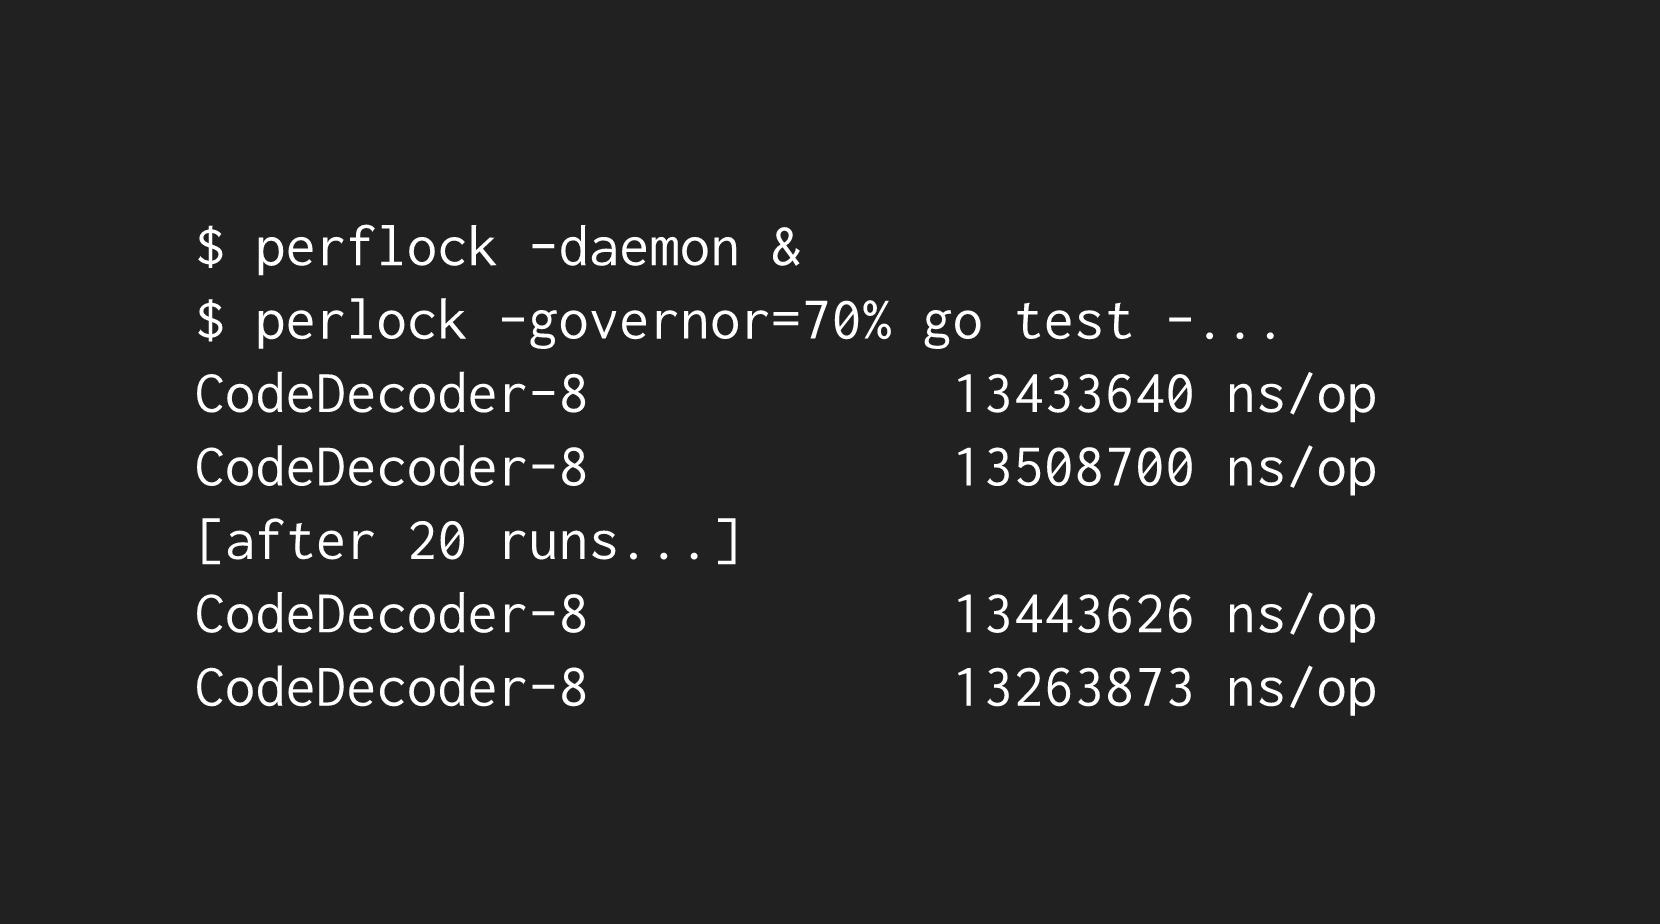
In the example above, we limit our benchmark to up to 70% CPU utilization, which is enough to prevent our computer from having to throttle its CPU.
While benchstat can be used to analyze multiple benchmark executions to compute the mean and variance, it can also be used to understand how a change you made impacted the performance of your code. Let's look at an example:
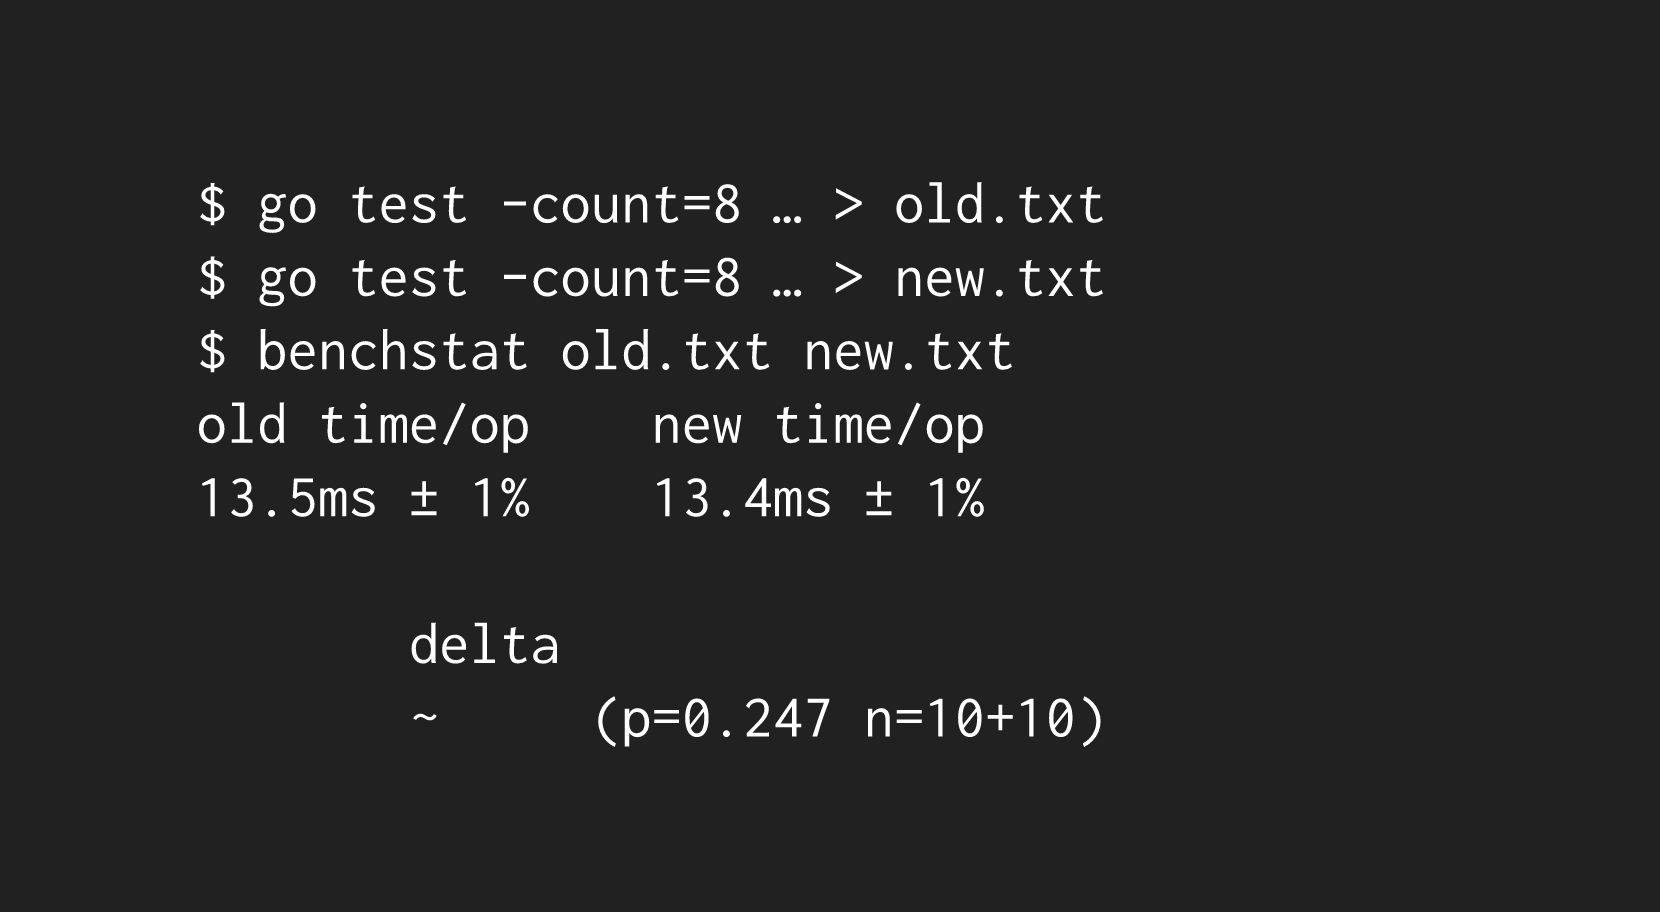
As you can see above, our new code ran, on average, in 13.4ms vs. 13.5ms. ...Woohoo? Thankfully, benchstat provides some statistical context at the bottom to help us understand if this improvement is statistically significant. Usually, instead of a ~ we'll see a +/-X.XX% change between the two sets of benchmark executions. However, in this case benchstat decided that the delta was not significant enough because of the high p-value (0.247). What's a p-value? Think of it as the probability, assuming our change had no impact on the performance of our code, of seeing benchstat report a performance improvement at least as good as what we just saw. Lower p-values are better, because that means any improvement that benchstat found is more unlikely to have occurred without a meaningful performance improvement.
Now for a surprise -- that was actually two runs of the same code with no changes! A p-value of 0.247 is actually quite bad, and in general you'll want a p-value of <= 0.05 for an improvement to be statistically significant.
Benchmarking Recap
With that, you can now write benchmark tests and use benchstat to understand the performance of your code, then use pprof to identify potential changes, and test them in a reliable environment with perflock + benchstat!
Detour: Compiler Optimizations
You may have heard of Moore's Law -- that computing power (well, transistor count) will double every 18 months -- but what about Proebsting's Law? It postulates that advances in compilers double computing power every 18 years. Not nearly as exciting, but nonetheless shows that compilers can give us significant performance improvements! And given that we now know a good deal about benchmarking our code, let's spend some time talking about some of the ways the Go compiler helps us out, too.
Before we dive into compiler tricks, consider giving the cmd/compile doc a read to get a high-level introduction to the Golang compiler.
Function Inlining
You can pass arguments to the compiler with the -gcflags flag, via go build. As an example, if you pass the -m flag twice, it'll cause the compiler to output which functions it could inline, but didn't:
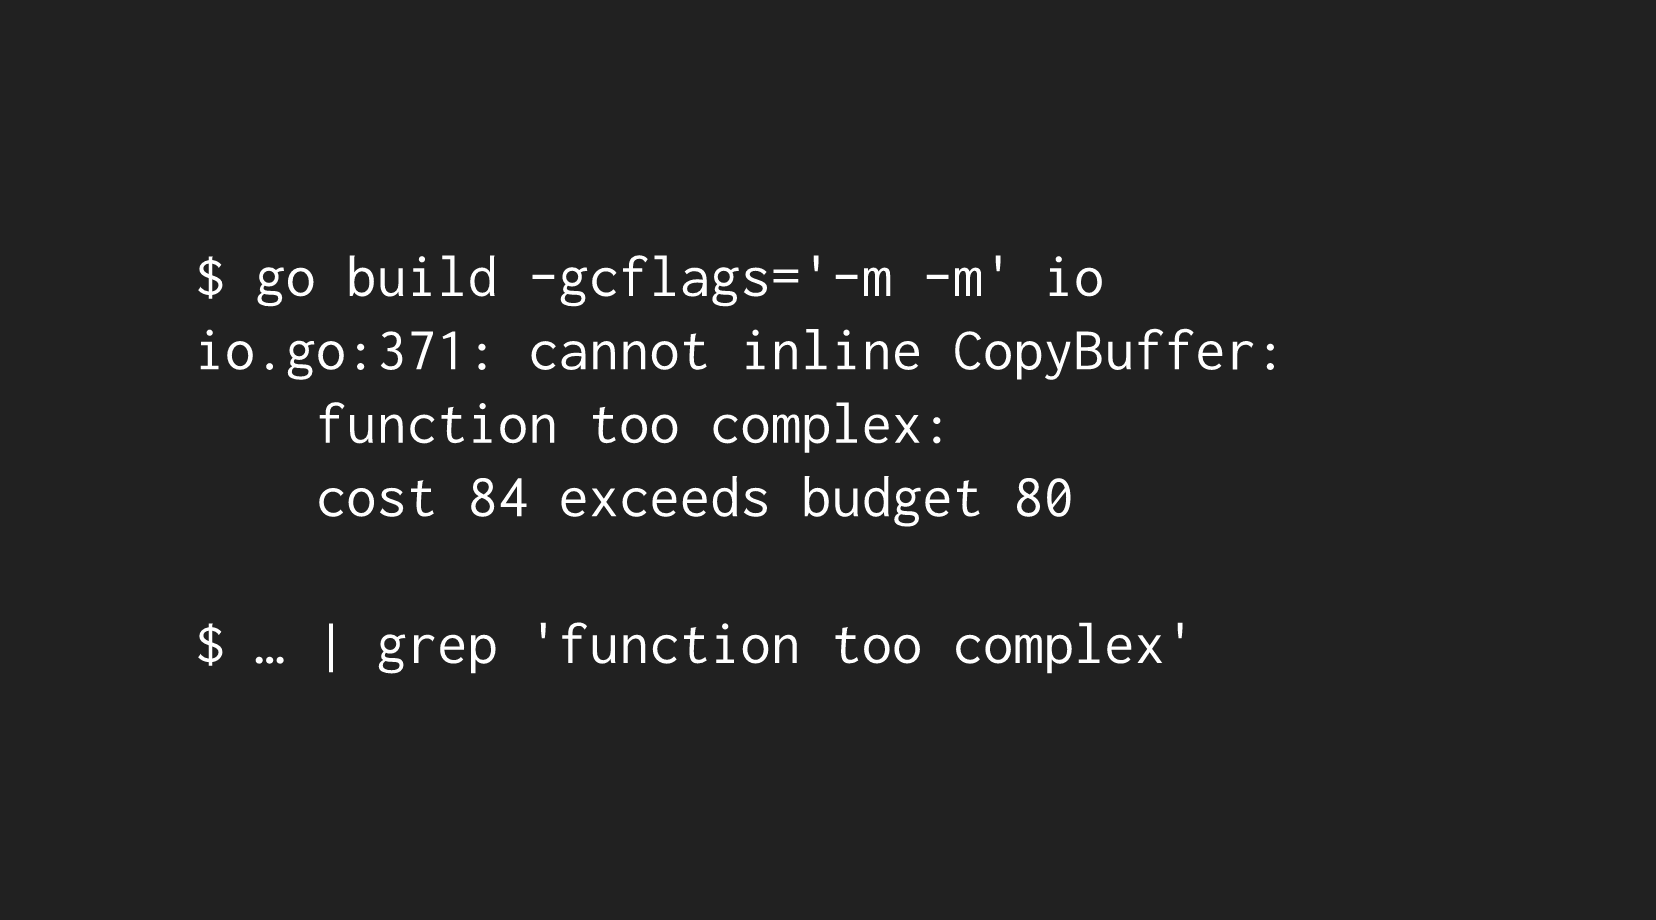
You can use this on your own code to identify functions that you could simplify in order for the compiler to be able to inline them!
Heap Allocations
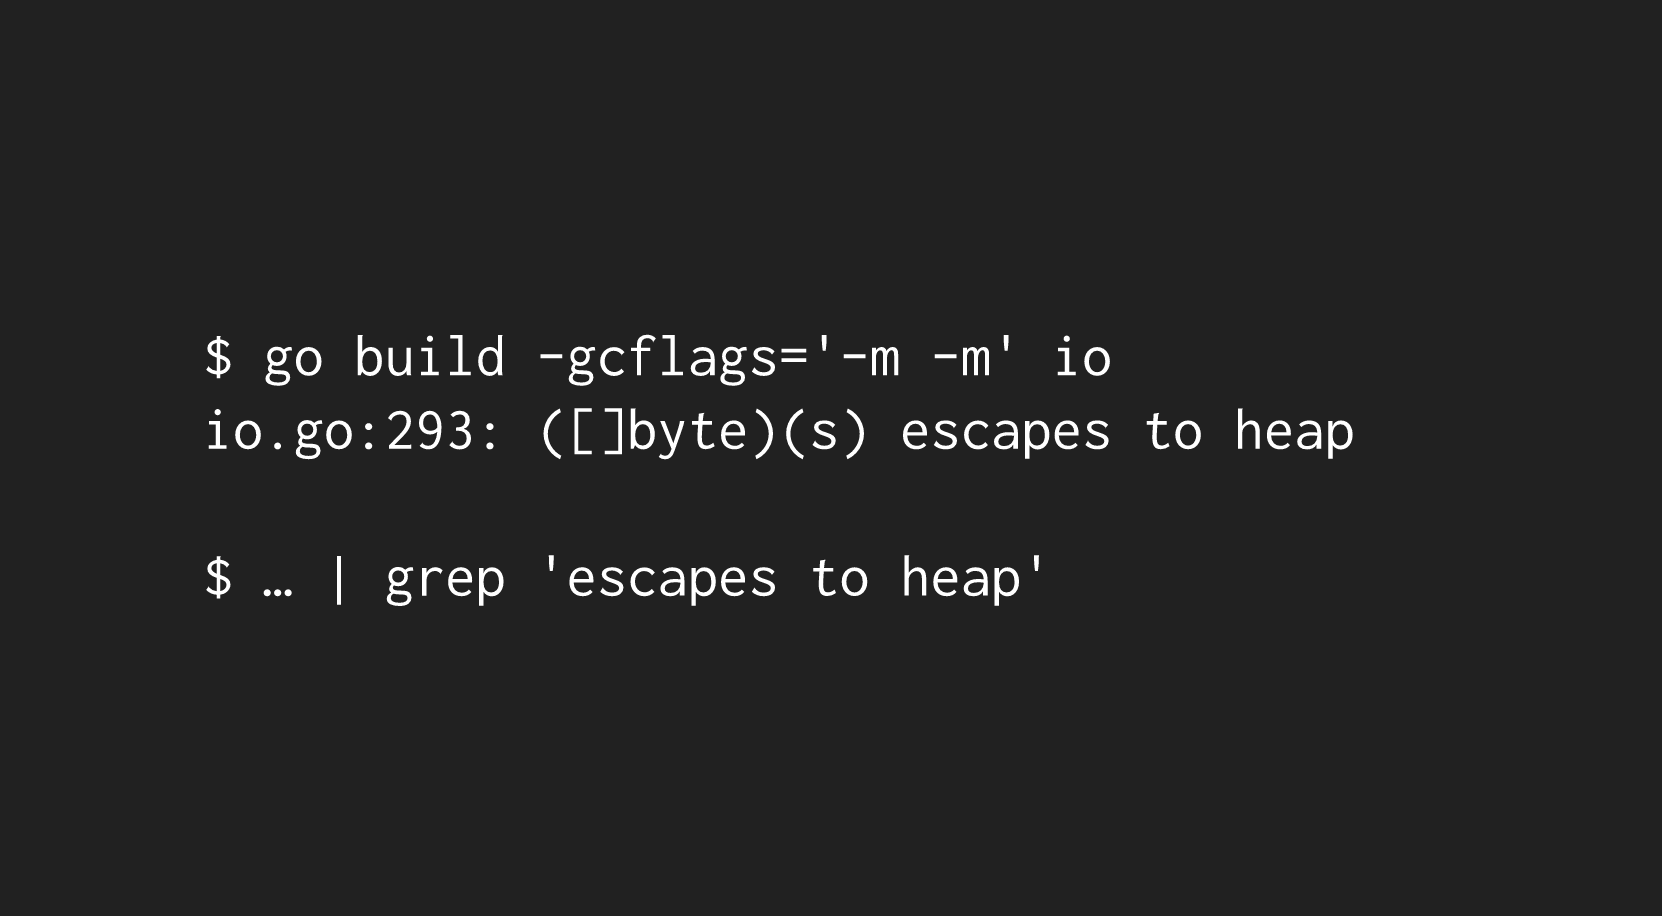
You can also use this compiler flag to find situations where expressions escape to the heap, requiring memory allocations. If you have a hot function that is generating a lot of allocations, this may help you identify why:
Bounds Checks
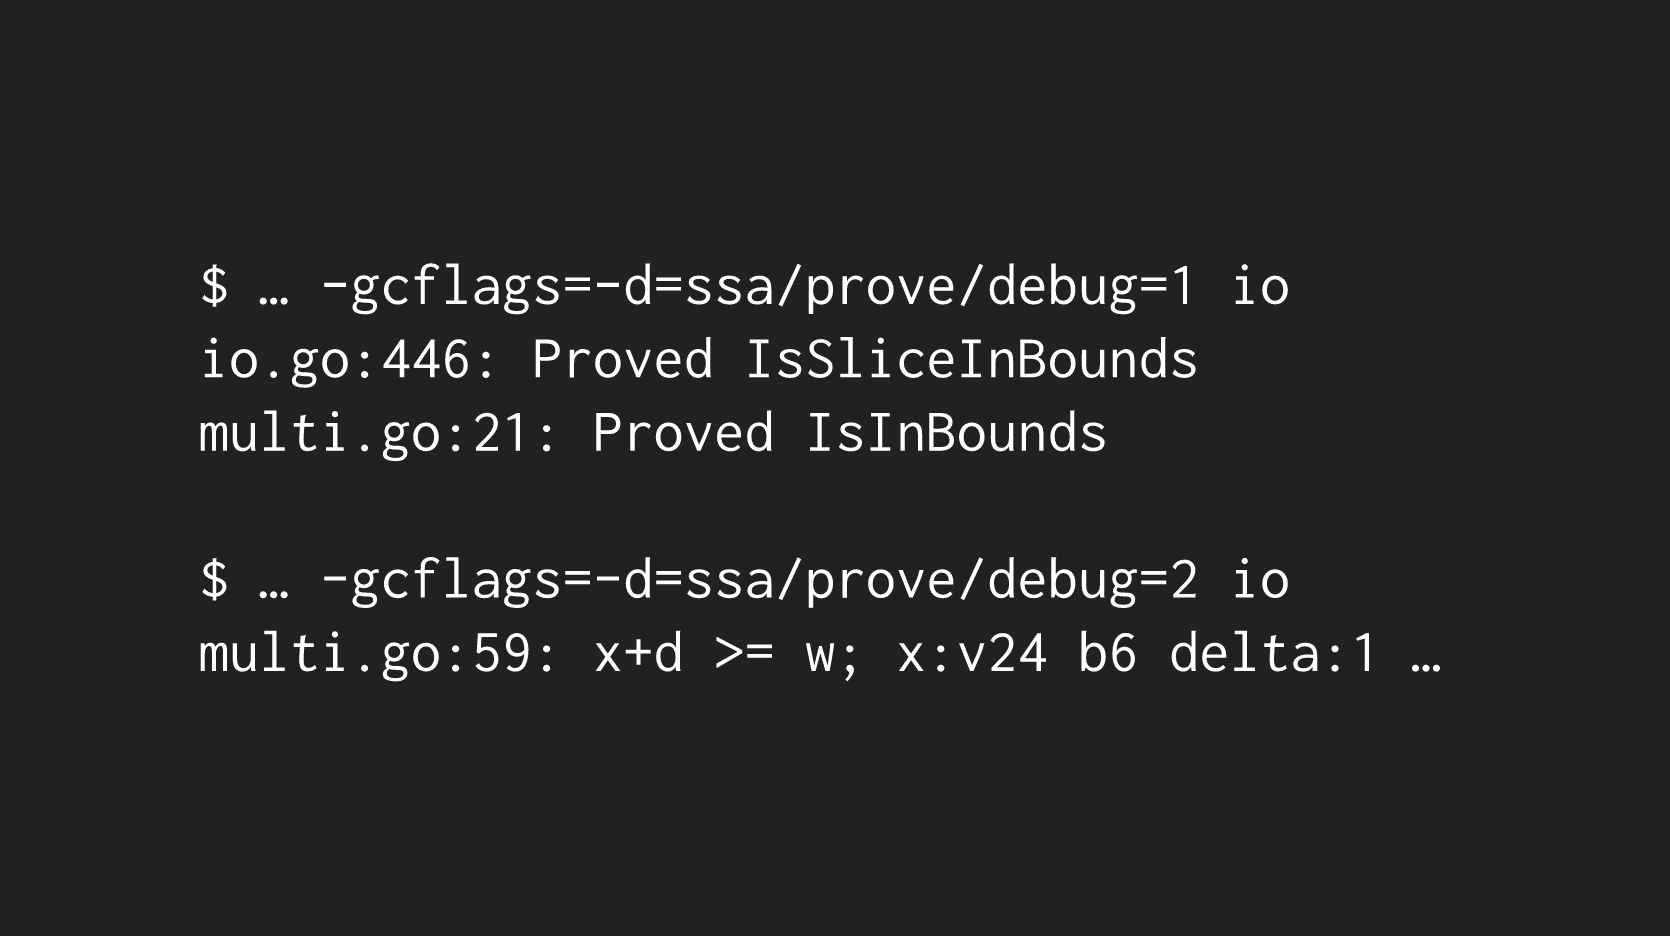
Whenever you index into a slice, the golang compiler generates a bounds check on the slice. The golang compiler performs an optimization pass (called balance check elimination, or bce) that removes these checks if it can determine that an indexing operation is statically safe. You can toggle on debugging for the prover, with a configurable debug level, to see whether or not these checks are able to be removed from your code:
Clearing Maps
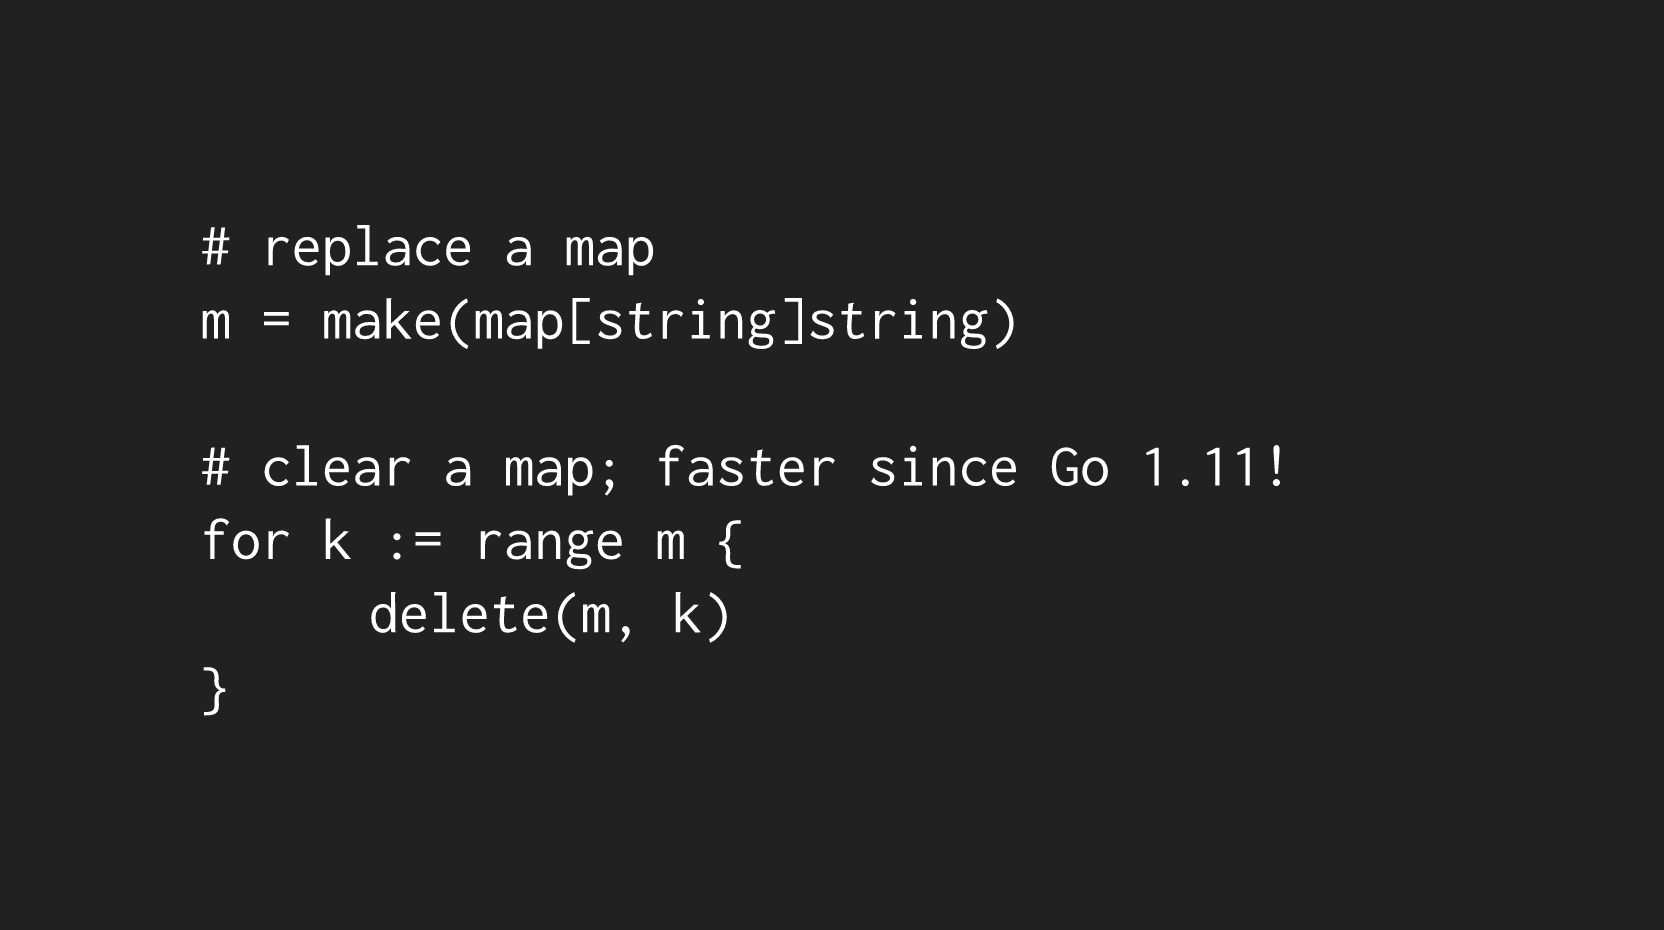
Before Go 1.11, the most efficient way to clear a map was to overwrite it with a newly-allocated map. However, that's not particularly efficient! As of Go 1.11 and beyond, you can now iterate over the keys in a map and delete each, and the compiler is smart enough to optimize this operation, which saves you a fresh map allocation!
Checking String Length
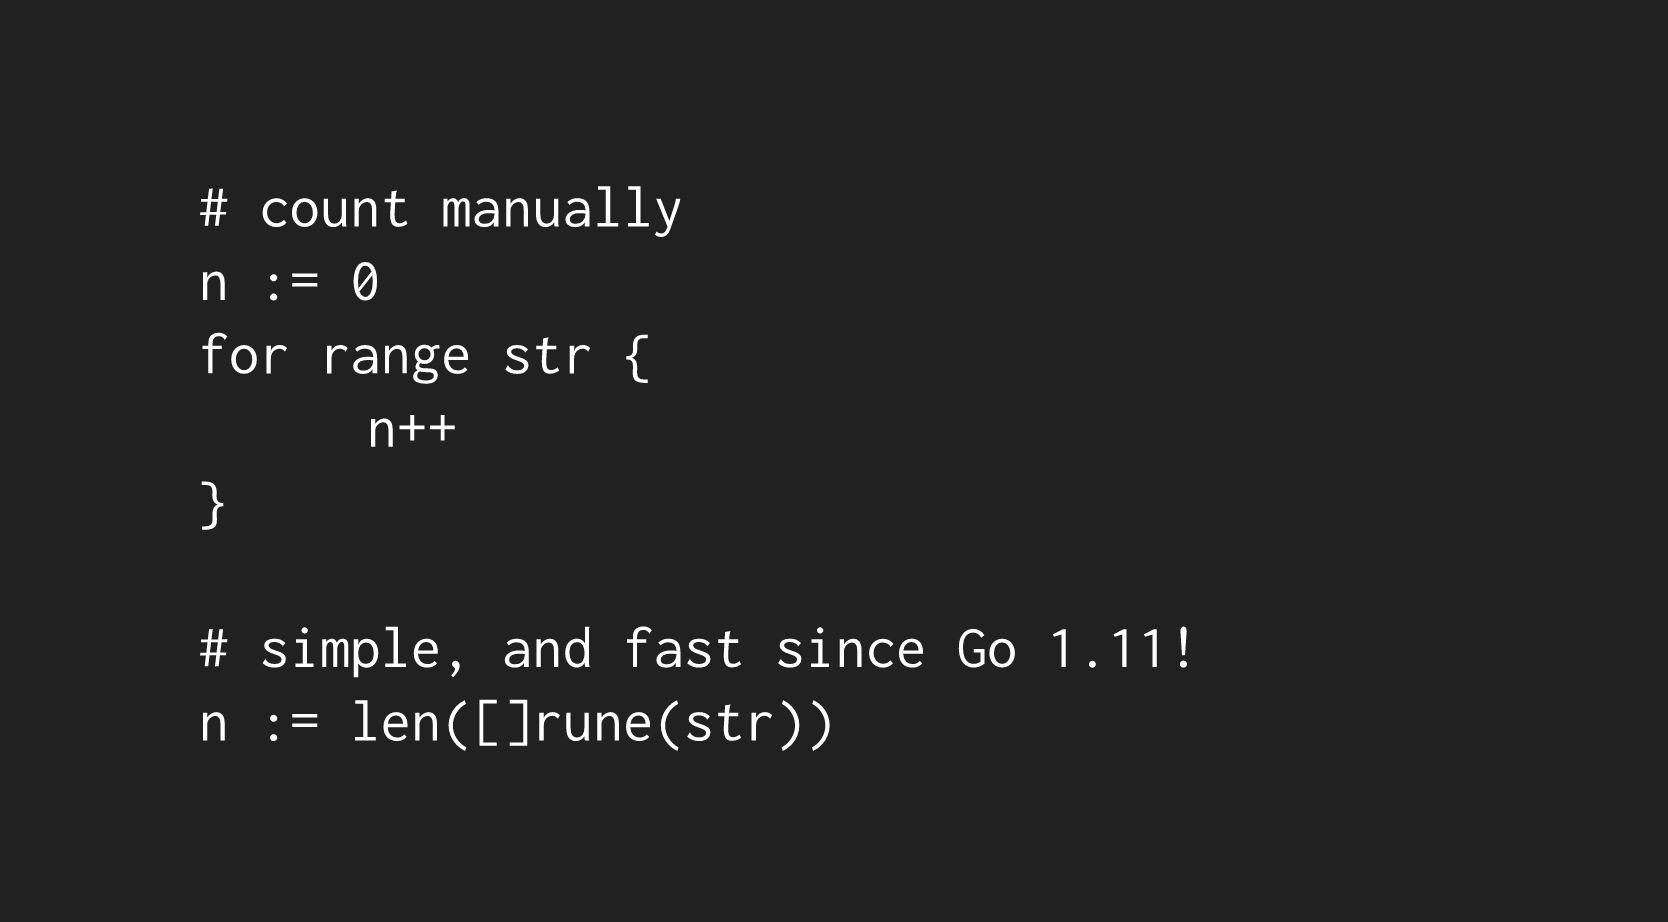
Similarly, the efficient way to compute the length of a string previously involved iterating over the string and counting the number of runes. However, you can now simplify that to a length check on a rune slice:
With all that said, consider giving the compiler a chance by writing code that it can optimize!
One More Thing: SSA Analysis

If you read through the Go compiler doc above, you'll know that the Go compiler uses an SSA (Static Single Assignment) representation of your source code to perform optimization passes. In their words: "In this phase, the AST is converted into Static Single Assignment (SSA) form, a lower-level intermediate representation with specific properties that make it easier to implement optimizations and to eventually generate machine code from it."
You can actually investigate the SSA output of a function in your package with a special environment variable, GOSSAFUNC, for go build:
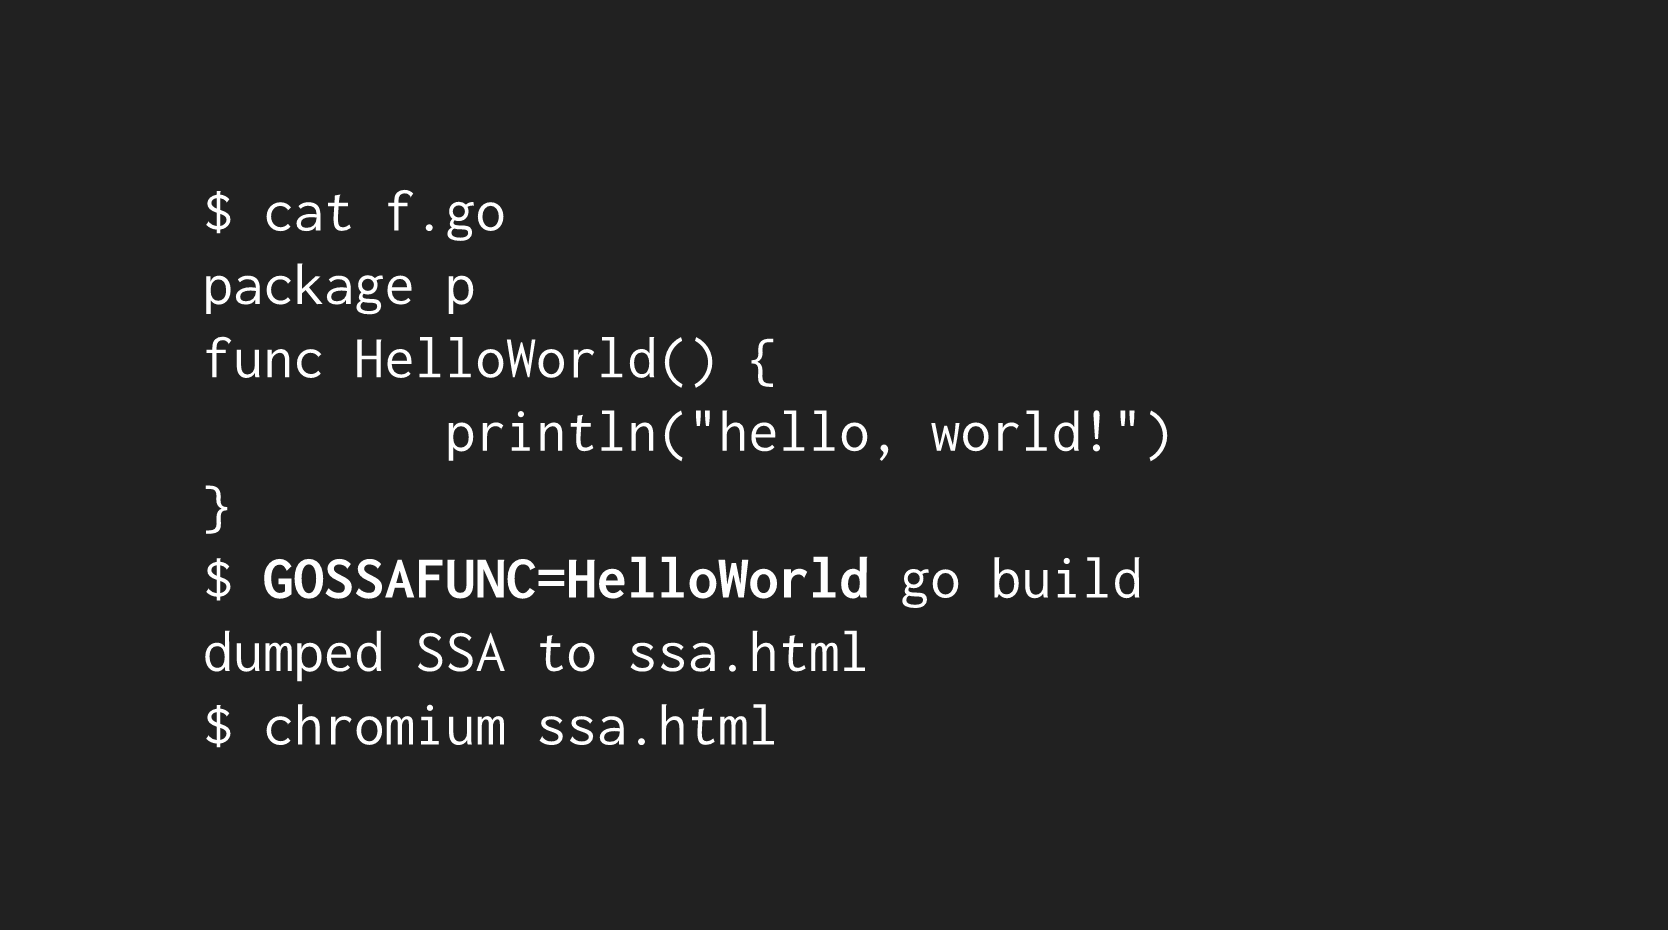
This generates the SSA output for the simple HelloWorld program above, which I've included here.
You can read more about the internals of the Go compiler's SSA phase with their introductory doc here.
You can see the full slides from Daniel's talk here.