An Introduction to go tool trace
Rhys Hiltner
Liveblog by Beyang Liu (@beyang)
Slides for this talk are available here.
Rhys Hiltner, software engineer at Twitch, works on improving developer experience there. He is the author of critical parts of the Twitch chat server (which he wrote in Go) and works on controlling the latency introduced by the garbage collector.
Today he's giving an introduction to go tool trace and describing how you can use it to debug concurrent Go programs.
Go makes it easy to use concurrency with goroutines, which means we do more concurrency, which means we have more concurrency problems.
CPU and memory profiling are common in other languages, but Go's tracing tool is more unique to Go, because Go code is more often high concurrency. It hooks directly into the goroutine scheduling implementation. The UI should be familiar to anyone who has used the tracing tool in Chromium.
When you read the docs, using the Go execution tracer seems very simple:
$ go doc runtime/trace
package trace // import "runtime/trace"

Go execution tracer. The tracer captures
a wide range of execution events ...

A trace can be analyzed later with
'go tool trace' command.
But then you end up with something like this:

The remainder of the talk will talk about how to decipher the tracing output and how you can use it effectively. To do that, we'll walk through 3 demos:
- A timing-dependent bug
- What the tracer doesn't show (it won't fix all your problems)
- Investigating latency during GC
A timing-dependent bug (race condition)
Here's how you test, build, and install Go binaries with the race detector enabled:
go test -race
go build -race
go install -race
The race detector will detect race conditions and warn you when they occur:
==================
WARNING: DATA RACE
Read at 0x00c420141500 by goroutine 27:
...
Previous write at 0x00c420141500 by
goroutine 26:
...
Note that the Go race detector detects data races, and that data races are NOT the same as logical races ("race conditions"). A data race is concurrent access to a single memory address by 2 or more threads where at least one access is a write. A logical race is a bug in a program due to the timing and ordering of events. You can have a data race that does not manifest itself in an observable error and you can have a logical race that does not include a data race.
gRPC, HTTP/2, and flow control
This is a bug that involves gRPC and HTTP/2. We have a server serving client requests in parallel, and it does flow control to make sure the bits get sent to the right consumers.
Here's what the trace looks like when we encounter the bug:
Note the long pauses.
This server would send very large and very slow responses to its clients. It was typical for clients to say "eh I don't need that data actually" and then issue another request.
So to investigate, we run a command to create the trace output file. Then we pass that file to go tool trace. We get several options for visualizing the data:
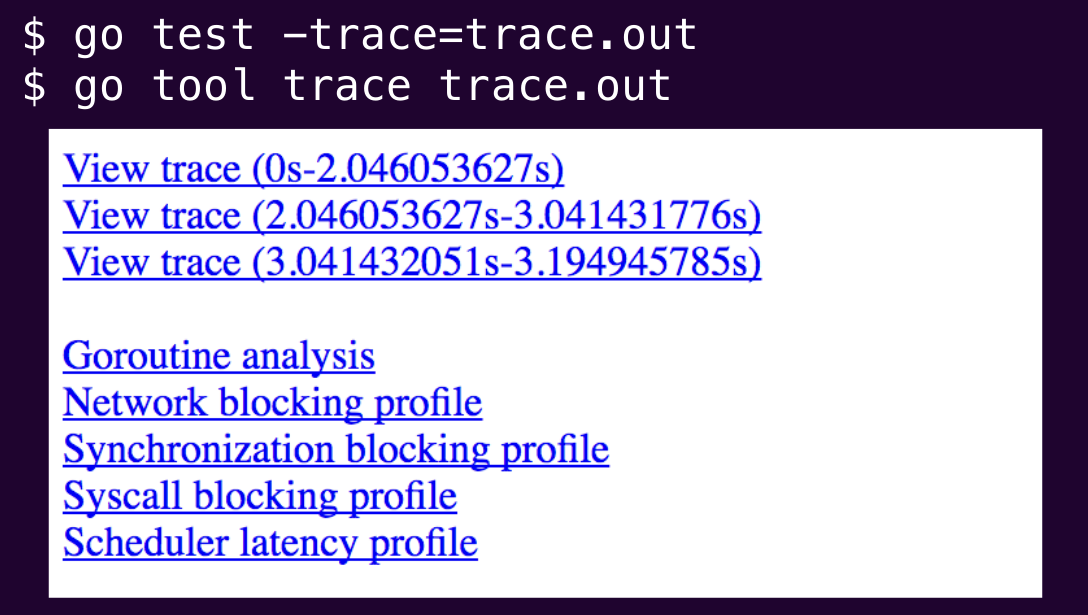
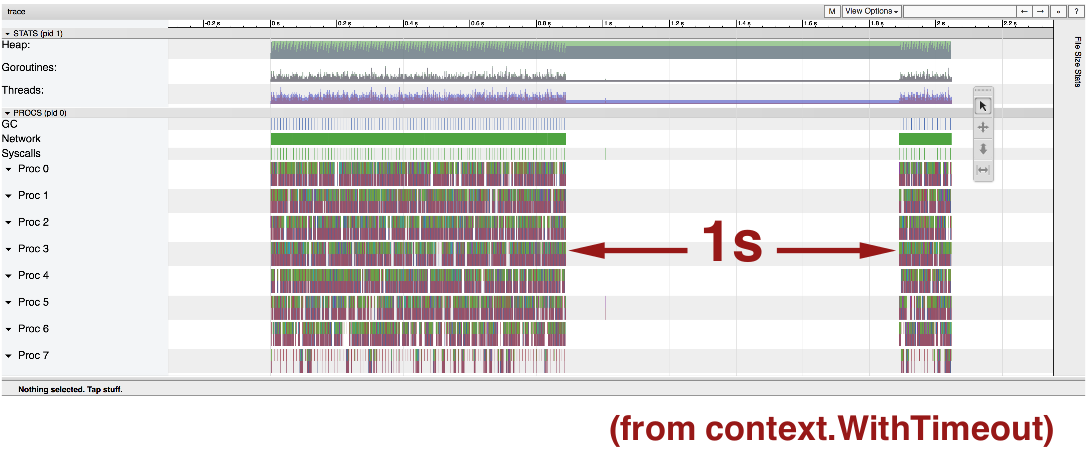
Visualization 1: "View trace"
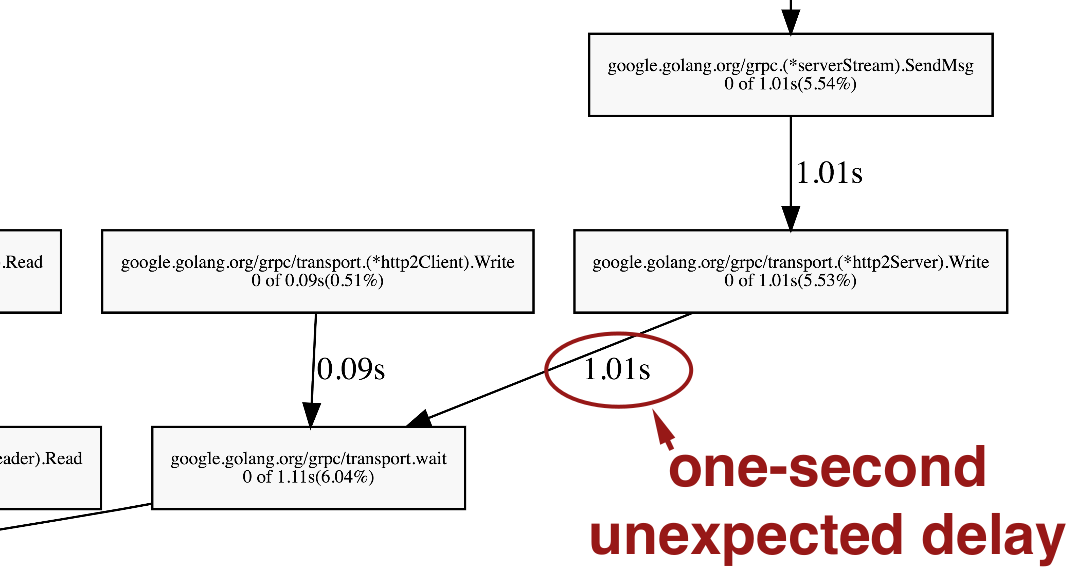
Note the 1 second pause. The fact that it pauses is surprising. We'd expect this server to be continuously serving client requests. But the 1 second length of the pause isn't surprising, because that's what the context.WithTimeout timeout is in the code.
We're going to click around a bunch in the tracing UI. If you do this yourself, consult the help screen:
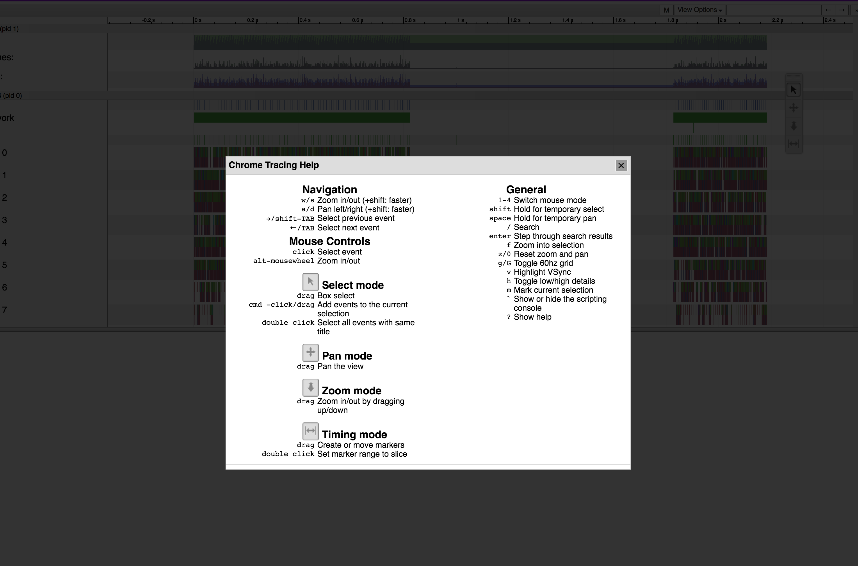
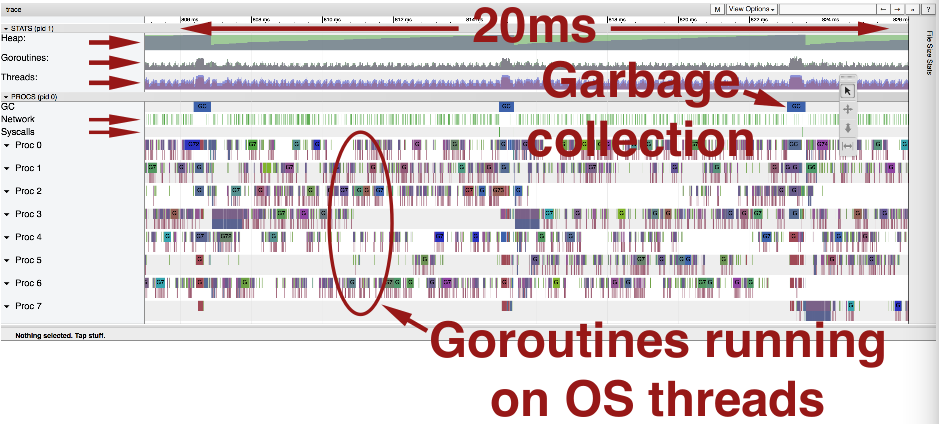
Here's a quick overview of this view:
Visualization 2: "Sync blocking profile"
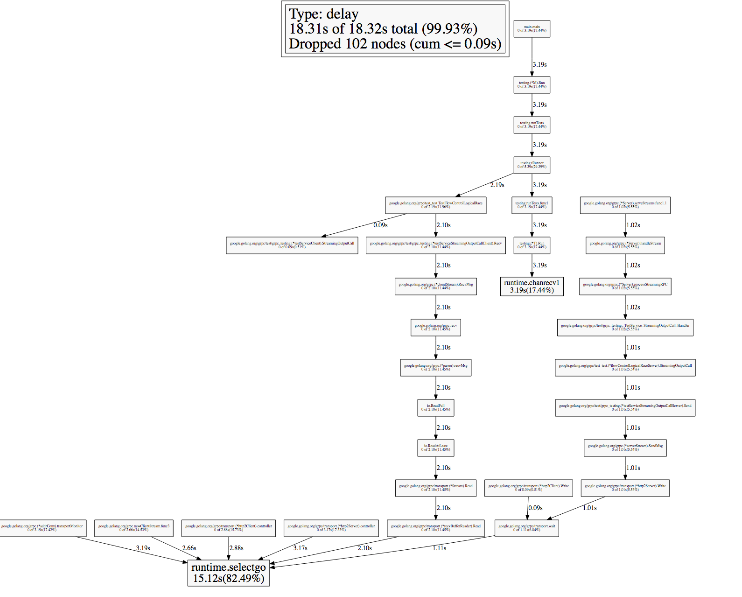
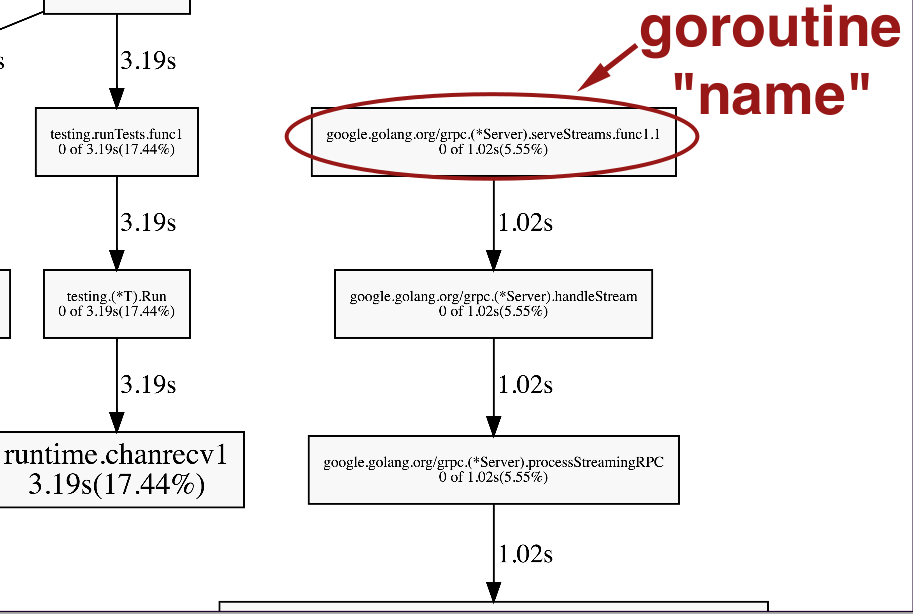
Let's use this visualization on our example:
Visualization 3: "Goroutine analysis"
All the different types of goroutines running in the program during the trace period:

Click the top item, with 10000 goroutines, and we get here:
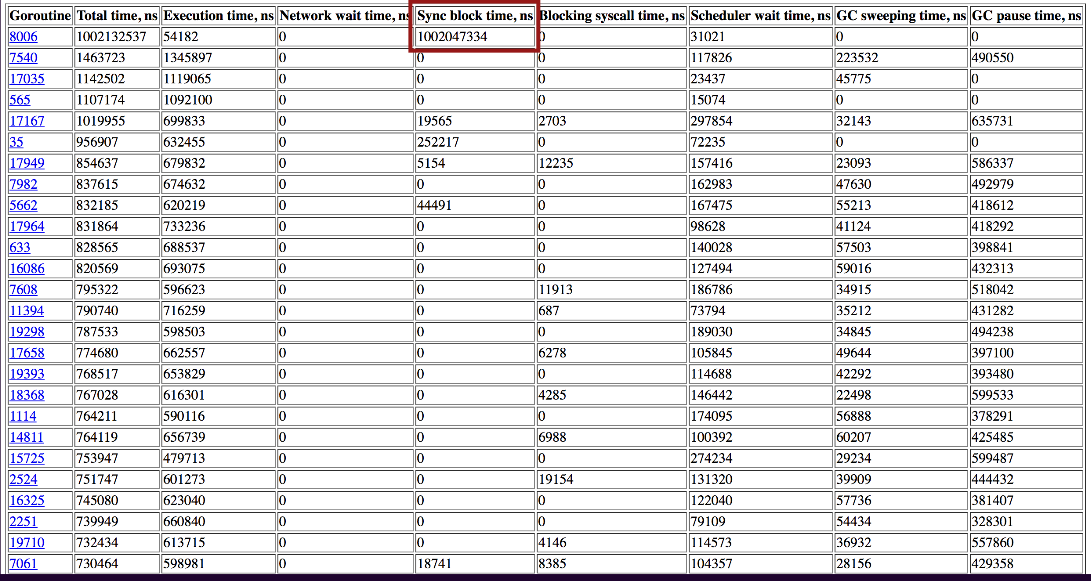
The Sync block time corresponds to the 1 second pause we saw.

What was the goroutine doing when it suddenly stopped? The Go execution tracer can lead us to the relevant code:


The body of that function is a giant select statement. The proceed channel is the only case that returns an actual non-error value.
func wait(ctx context.Context, ...,
  proceed <-chan int) (int, error) {

  select {
  case <-ctx.Done():
   // ...
   case ...: // stream closed, etc
   case i := <-proceed:
     return i, nil
   }
}wait's called from here:
t.sendQuotaPool.add(0)

tq, err := wait(s.ctx, ...,
  t.sendQuotaPool.acquire())

if err != nil && ... {
  t.sendQuotaPool.cancel()
  return
}

// calculate payload size ...
t.sendQuotaPool.add(tq-ps)
The quota pool looks like this:
type quotaPool struct {
  c chan int // positive quota here
  mu sync.Mutex
  quota int  // zero or negative quota
}
When we create it, the integer channel has capacity 1. Might be empty or might contain a single integer. If the initial quota is positive, the value is sent to the channel, other wise the value is put into the qb.quota field.
func newQuotaPool(q int) *quotaPool {
qb := "aPool{
c: make(chan int, 1),
}
if q > 0 {
qb.c <- q
} else {
qb.quota = q
}
return qb
}Acquire method is trivial:
func (qb *quotaPool) acquire()
  <-chan int {
  return qb.c
}
The add method is interesting. Protected by a lock. Does arithmetic to figure out how much quota leftover. If quota left, attempts to send, then zeros out.
func (qb *quotaPool) add(n int) {
  qb.mu.Lock(); defer qb.mu.Unlock()
  if qb.quota += n; qb.quota <= 0 {
  return
}
select {
  case qb.c <- qb.quota:
    qb.quota = 0
  default:
  }
}
cancel method pretty much breaks the invariant we might want to make by receiving on the channel. When this function returns, the channel is definitely empty.
func (qb *quotaPool) cancel() {
  qb.mu.Lock(); defer qb.mu.Unlock()
  select {
  case n := <-qb.c:
    qb.quota += n
  default:
  }
}
Here's how execution of these methods might interleave across multiple goroutines:

or it might do this
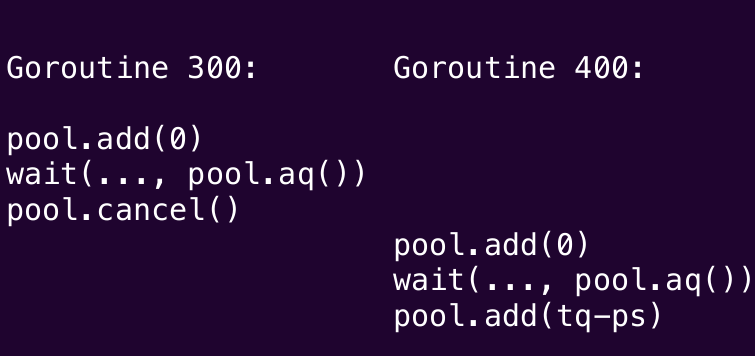
or maybe this

Let's take a look at the goroutine that's about to stall. It overlaps completely with the goroutine above it. They overlap for 36 microseconds.
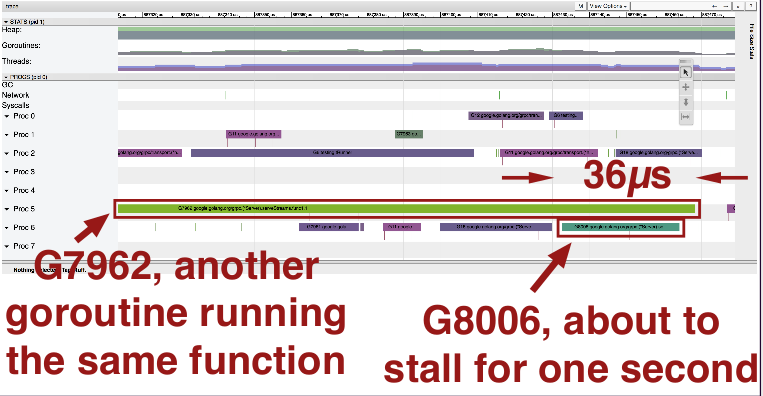
So it looks like it's doing this:
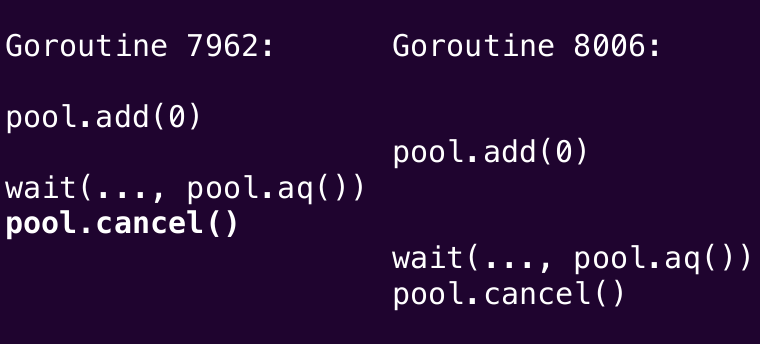
So the cancel method appears to be the culprit here. So we delete it.
In addition, we need to modify the add function to always clear the channel, always calculate the total quota available, and if positive, always put value back on channel. So if any quota available, always ready to receive.
func (qb *quotaPool) add(v int) {
  qb.mu.Lock(); defer qb.mu.Unlock()
  select {
  case n := <-qb.c:
    qb.quota += n
  default:
  }
  if qb.quota += v; qb.quota > 0 {
    qb.c <- qb.quota
    qb.quota = 0
  }
}
The Go tracer is not a panacea
This is just one tool. If you want to know what a goroutine starts or stops or why it stops or starts, this tool answers that question. Other questions? You probably need a different tool.
There's three ways to get the tracing data.
- Testing with -trace flag
- Direct runtime/trace use
- net/http/pprof handlers
This is an execution trace from another program:

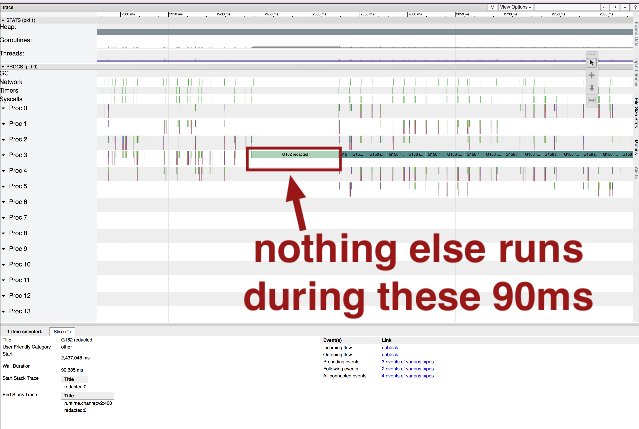
Note:
- suspicious gaps
- heavy garbage collection
- another type of goroutine that doesn't look like the others
runtime.ReadMemStats and large (40GB) heap leads to long pauses in Go 1.8 or earlier (fixed in Go 1.9).
What about the other goroutine?
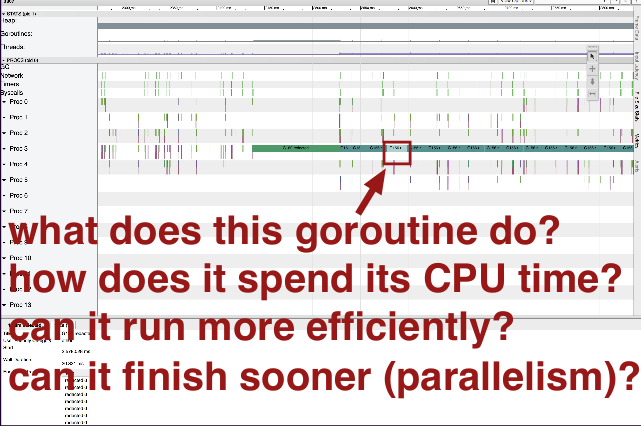
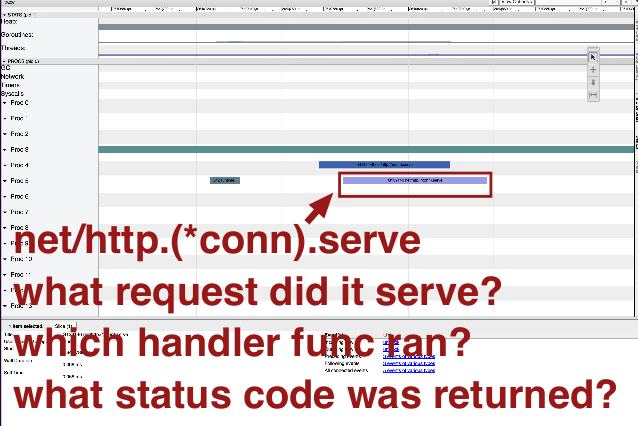
Note these questions do not pertain to when the goroutine starts or stops, so the execution tracer is probably not the right tool to answer these questions. It might be helpful to add the capability to provide annotations to the tracer for additional context, but that's not currently a feature.
The GC is still improving
Go's garbage collector has come a long way, but it's still improving.
Here's an execution trace from a server:
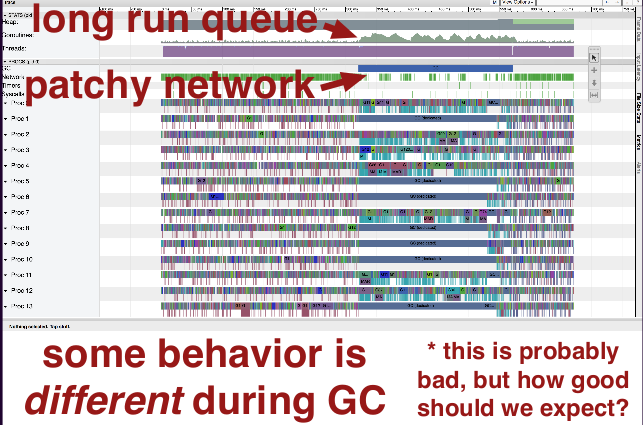
Note the number of goroutines waiting to run increases (note the bump).
There's also patchiness in the client network requests. The clients don't magically know about the server's goroutine usage, so this seems suspicious.
And some behavior is different during GC, which is expected, but it would be nice if it were as close to non-GC behavior as possible.
A brief history of Go garbage collection timeline:
- Go 1: program fully stopped
- Go 1.1: GC uses parallel threads
- Go 1.4: precise collection (understood the difference between large integers and pointers)
- Go 1.5: global application pauses < 10ms
- Go 1.8: individual goroutine pauses < 100μs
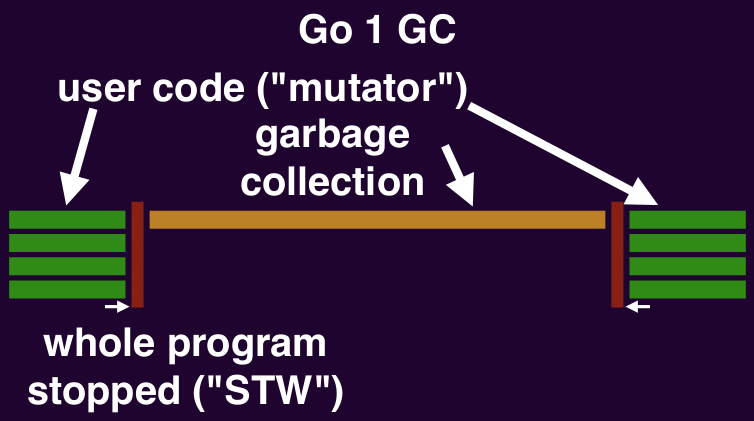
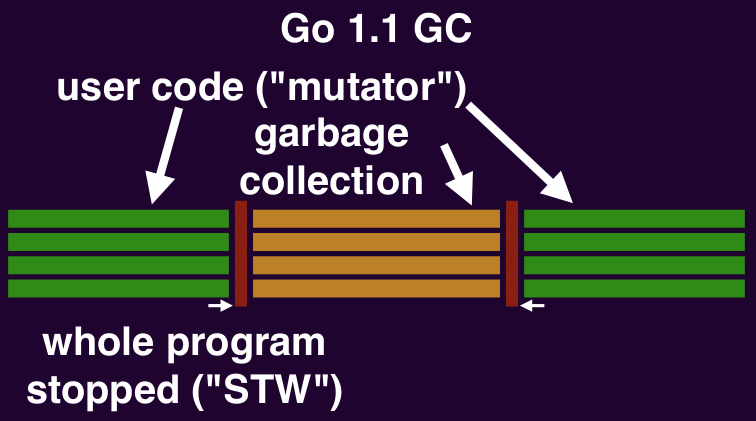
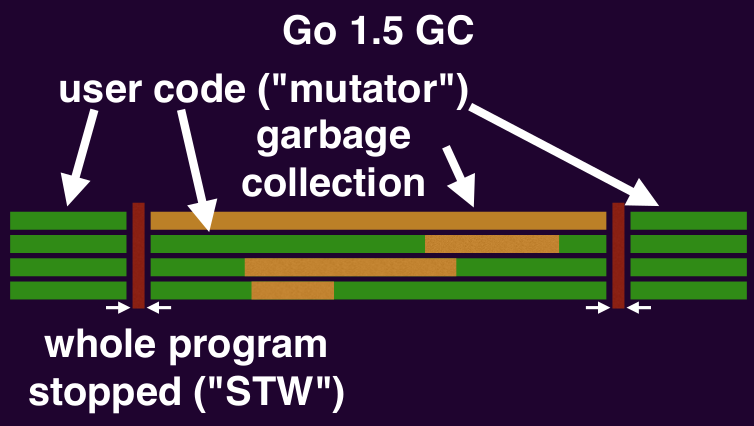
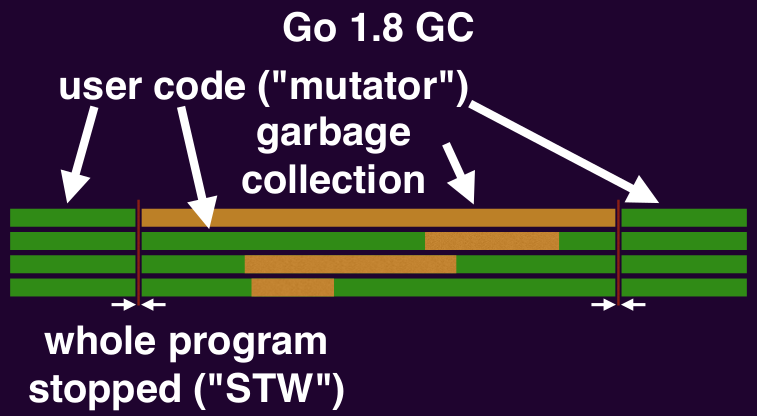
Stop the world pauses
Everything stops when the GC begins and ends its mark phase (garbage collector does bookkeeping here that requires user code to stop). Stopping everything takes time:
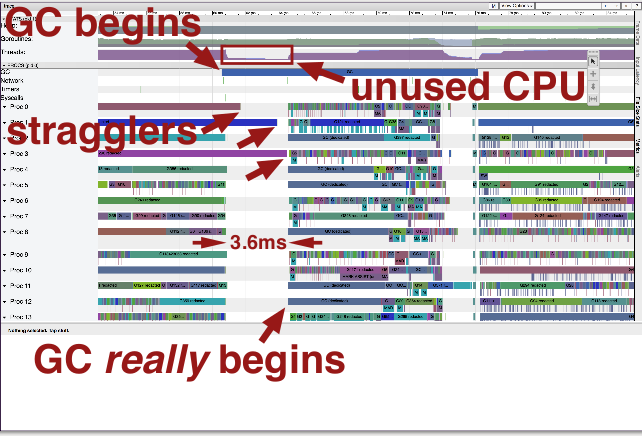
Here, we have an issue, because a few straggler goroutines don't stop with the others. GC can only begin after all goroutines have stopped. In the 3.6ms gap between most goroutines stop and when the laggards stop, GC cannot proceed and there is no CPU utilization.
Why does this happen? Well, goroutines can stop when:
- ✓ allocating memory
- ✓ calling functions
- ✓ communicating
- ✗ crunching numbers in a loop
So if you're crunching numbers in a loop, your goroutine might chug on refusing to stop. You can observe this behavior if you use:
- encoding/base64
- encoding/json
- .../golang/protobuf/proto
It's measurable for 1MB values if you're looking for it (check code lines before "End Stack Trace"). Or just write your own tight loop to observe it:
go func() {
  for i := 0; i < 1e9; i++ {
  }
}
The Go 1.10 compiler should have a general, permanent fix (golang.org/issue/10958). The workaround is available now.
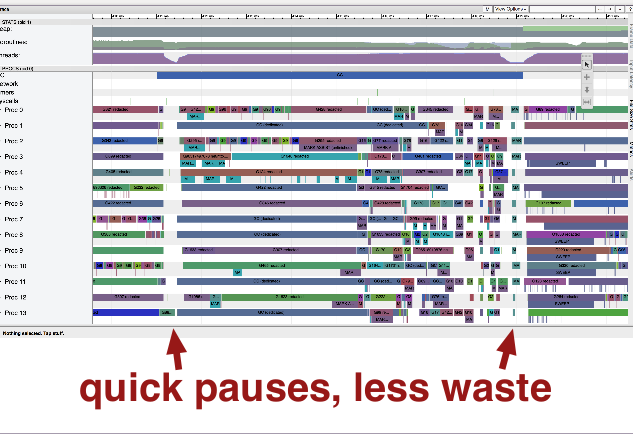
Other awkward pauses
There's a couple of other ways that GC can make your program have awkward pauses.
Recall that in a mark/sweep GC,
- "mark" finds in-use memory
- "sweep" reclaims the rest
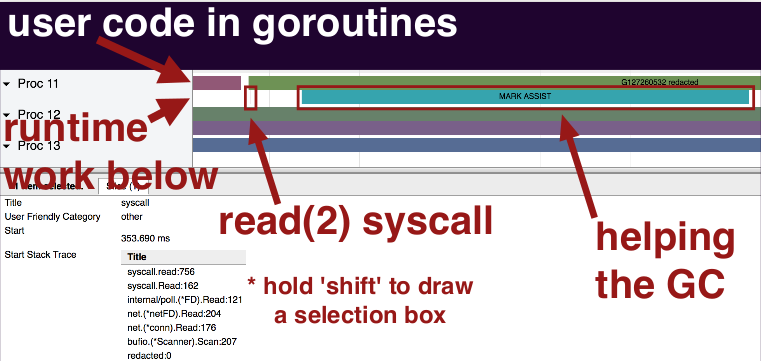
The GC needs to make progress; it needs to know that it will collect garbage before we OOM. User code works against that. User code is forced to help out the GC.
Each of these goroutine lines has 2 rows. The top is user code, the bottom is GC:
Here's an assist that ran for 4.4ms:
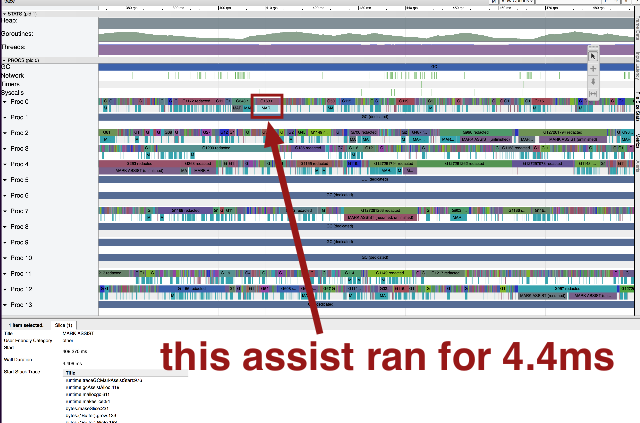
Other assists are slower:
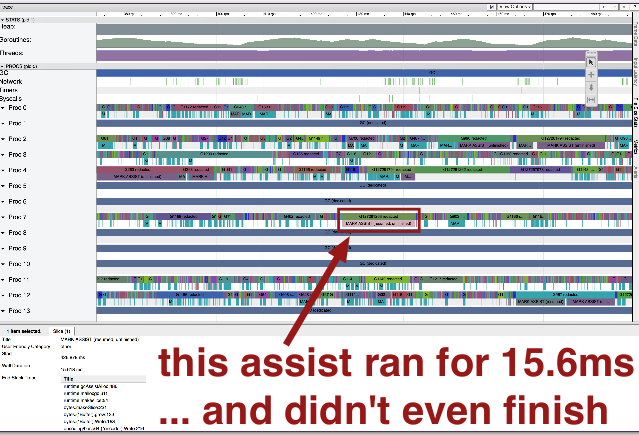
...but that goroutine probably allocated 10MB of memory, so it deserved what it got.
Most assists are well-deserved, but they start suddenly.
Sweeping requires assists too. So consider not allocating in critical paths as best you can.
Recap
Check it out: go tool trace
How can go tool trace help you?
- See time-dependent issues
- Complements other profiles
- Find latency improvements
Q&A
Q: What's the overhead of all the profiling stuff?
A: Short answer: worth it. Longer answer: Generally low overhead. I ask people before making these types of requests to their code, but I don't think twice about tracing my own.
Q: Do you recommend running it all the time on production code?
A: I definitely recommend having it enabled, so you can make the HTTP request to fetch the data. But probably don't need to invoke the profiler every second.